2024 ARC-CO PLC Decisions Using IFBT
Using IFBT.Farm to Analyze Your Farm's 2024 ARC-CO PLC Decision
Summary
In early January, the FSA released the data for the ARC-CO and PLC programs for the 2024 crop year. With this data, farmers can now calculate the trigger points for payments as well as the dollar amount of payments under various scenarios of final Marketing Year Average (MYA) price and final county yields. The IFBT.Farm application can help farmers easily evaluate their own farm’s title payments under various scenarios of final 2024 MYA prices and final 2024 county yields.
Several important changes have occurred since 2023 that cause each of PLC and ARC-CO to have a higher probability of triggering for the 2024 crop year. Price triggers for PLC are higher for corn and beans (although not for wheat). ARC-CO county benchmark revenues are higher for corn, soybeans and wheat across the country. Harvest prices (and therefore expected MYA prices) are materially lower today than they were at this time last year. Each of these factors improves the probability of title payments being made.
Although neither ARC-CO nor PLC are expected to trigger payments at today’s prices and expected yields, unlike the 2023 crop year, only relatively modest declines in prices or county yields from current levels are required to trigger title payments.
In our Montgomery County IL farm example described below, ARC-CO appears to be the preferred choice for corn and soybeans base acres and PLC appears to be the preferred choice for wheat base acres.
The title decision is one part of overall farm risk management and should be considered as an integral part of a holistic view of farm profitability under various price and yield scenarios. This blog post walks through the actual payments that would be made to the farmer under ARC-CO and PLC and those differences. It then shows how those potential payment streams impact upon the overall picture of the farm’s profitability by walking the reader through an example of the budgeting and risk management decisions of a Montgomery County, IL farm.
PLC
PLC payments are triggered when MYA prices fall below the Effective Reference Rate. The table below shows the change in effective reference rates from the 2023 ARC/PLC program to the 2024 ARC/PLC program. Higher Effective Reference Rates for corn and soybeans improve the probability of PLC payments triggering in 2024.
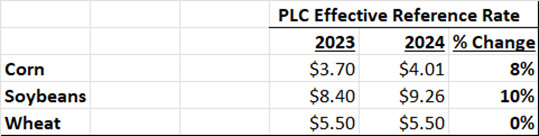
In 2023 prices would have had to have fallen quite substantially to produce MYA prices to trigger PLC payments. The PLC trigger price was below harvest futures prices by 38% for corn, 40% for soybeans and 28% for wheat. For 2024, harvest prices are much closer to the PLC trigger price. The PLC trigger price is below harvest futures prices by 17% for corn, 23% for soybeans and 13% for wheat. Therefore, the required decline in prices to trigger PLC payments in 2024 are considerably less than they were in 2023.

ARC-CO
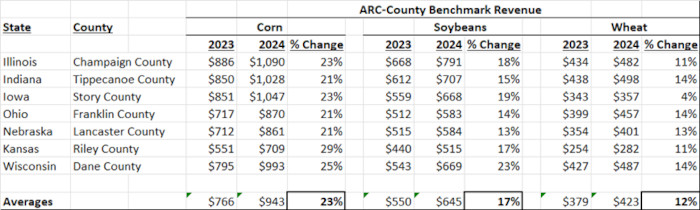
ARC-CO payments are triggered when county revenue falls below 86% of benchmark county revenue. The table below shows several examples of the benchmark county revenues for corn, soybeans and wheat for several different states and counties across the Midwest. The higher benchmark county revenue for each of corn, soybeans, and wheat while differing in each state and county, improves the probability of ARC-CO payments triggering in 2024. Note that the average increase in the benchmark county revenue from this small sample of states/counties listed below is 23% for corn, 17% for soybeans and 12% for wheat.
Both PLC and ARC-CO payments have a higher probability of triggering when MYA prices are lower. The final MYA price is a determination made by the USDA of the actual average price received by farmers across the U.S. for their grain over the entirety of the marketing year (from harvest through to the following August). MYA prices are discussed in more detail later in this article.
Current harvest prices do not directly translate into the final MYA prices as prices can rise or fall over the course of the crop and marketing year. Final MYA prices also reflect not only harvest futures prices but also the basis that farmers receive across the country. However, harvest futures at any point in time do provide a reasonable directional proxy for the potential future MYA prices and the associated triggering events for PLC and ARC-CO payments in any given year. As noted in the table below, harvest prices have fallen materially for the 2024 crop year as compared to harvest prices at the same time for the 2023 crop year. This decline in prices causes both PLC and ARC-CO payments to be more likely in the 2024 crop year than in 2023 crop year.

The combination of higher PLC effective reference rates, higher benchmark county revenues and lower harvest prices cause the likelihood of payments for the 2024 crop year to be much higher than the 2023 crop year. In 2023 the selection between ARC-CO and PLC was not critically important as both program choices were very “far out of the money” and highly unlikely to trigger payments. In 2024, while neither program would make a payment at today’s prices and expected county yields, as compared to 2023, ARC-CO and PLC are much “closer to the money” and much more likely to trigger payments with relatively modest declines in prices and county yields.
ARC-CO or PLC example for a Montgomery County, IL Farm
So which program will likely be better for your farm? Attached are screen shots from IFBT that depict an example for a 2,000 acre Montgomery County, IL farm.
This operator’s FSA 156 cards indicate that the farm has a total of 975 corn base acres with an average 160 PLC yield, 925 bean base acres with a 50 average PLC yield, and 150 wheat base acres with an average 65 PLC yield. With this data and the use of the IFBT application, the farmer can easily determine the amounts of payments that would be received under various MYA price and county yield scenarios. The screen shots below show the dollar amount of payments (in thousands) that would be paid to this farmer under various MYA price and county yield scenarios and the differences in those payments.
CORN TITLE PAYMENTS
975 title acres, 160 PLC yield
PLC Payments $000 ARC-CO Payments $000
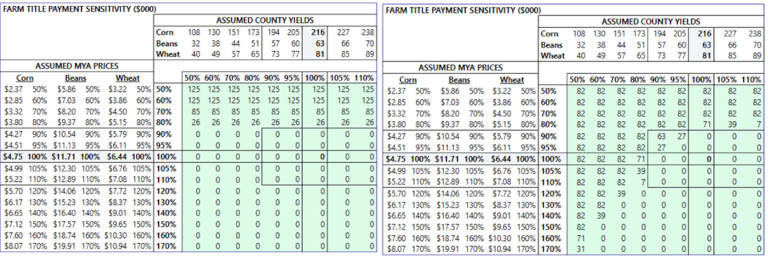
Differences Between ARC-CO and PLC $000
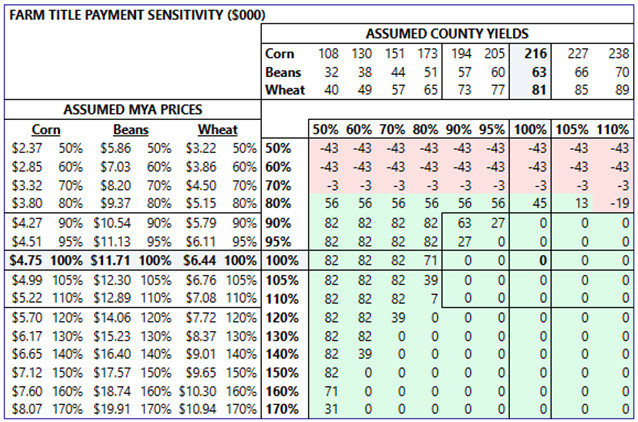
ARC-CO payments are higher than PLC payments where the numbers are green and are lower than PLC payments where the numbers are red. Therefore ARC-CO is better in most low yield situations and PLC is better in very low-price situations. Both ARC-CO and PLC payments are “out of the money” in the base case – at current prices and current yield expectations.
From a visual observation of the difference in payments in the table above, this farmer would likely lean toward ARC-CO in their title choice, as ARC-CO provides protection against both yield and price declines and with payments that exceed PLC payments in most nearby scenarios. However, in extremely low-price scenarios the farmer would be better off with PLC. Based on the program’s design, the absolute maximum for PLC payments will exceed the absolute maximum for ARC-CO payments based on differing caps of the two programs. However, ARC-CO does appear to provide better nearby protection than does PLC. Recall, however, that if this farmer were to select ARC-CO, the farmer would be prohibited from using SCO for crop insurance purposes for corn.
SOYBEAN TITLE PAYMENTS
925 title acres, 50 PLC yield
PLC Payments $000 ARC-CO Payments $000 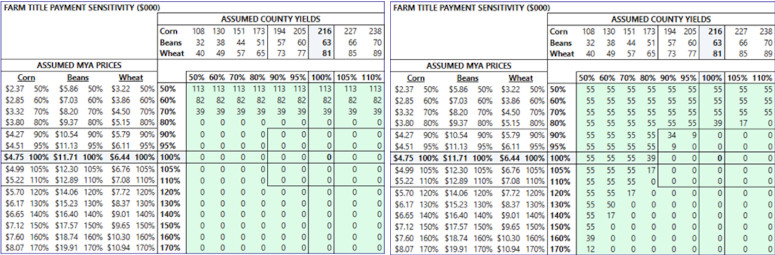
Differences Between ARC-CO and PLC $000
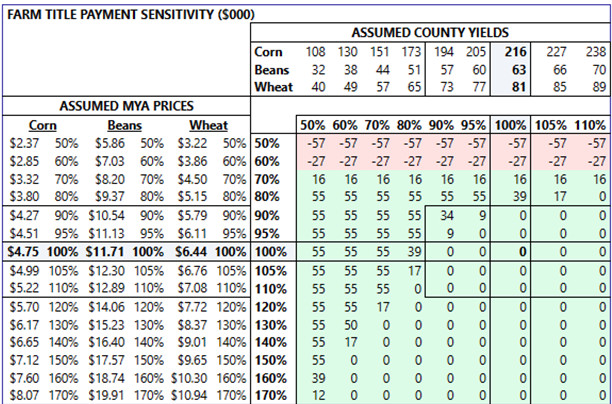
ARC-CO payments are higher than PLC payments where the numbers are green and are lower than PLC payments where the numbers are red. Therefore, similar to the corn payment profile, ARC-CO provides a better payment in most low yield situations and PLC is better in very low-price situations. Both ARC-CO and PLC payments are “out of the money” in the base case – at current prices and current yield expectations.
From a visual observation of the payout structures and dollar amounts in the table above, this farmer would likely lean toward ARC-CO in their title choice, as ARC-CO provides protection against both yield and price declines that exceed PLC payments in most scenarios. However, consistent with the example for corn, in extremely low-price scenarios the farmer would be better off with PLC. Based on the program’s design, the absolute maximum for PLC payments will exceed the absolute maximum for ARC-CO payments based on differing caps of the two programs. However, ARC-CO does appear to provide better nearby protection than does PLC. Recall, however, that if this farmer were to select ARC-CO, the farmer would be prohibited from using SCO for crop insurance purposes for soybeans.
WHEAT TITLE PAYMENTS
150 title acres, 65 PLC yield
PLC Payments $000 ARC-CO Payments $000 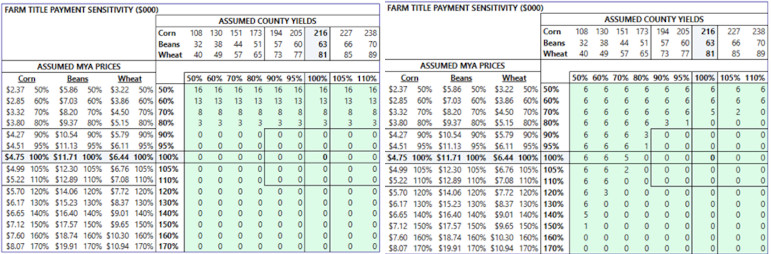
Differences Between ARC-CO and PLC $000
ARC-CO payments are higher than PLC payments where the numbers are green and are lower than PLC payments where the numbers are red. Unlike the corn and soybean decision, the choice between ARC-CO and PLC for wheat is less obvious. Both ARC-CO and PLC are fairly “far out of the money” in the base case – at current prices and current yield expectations.
From a visual observation of the payout structures and dollar amounts in the table above, this farmer would likely be indifferent between ARC-CO and PLC and the farmer would make the ARC-CO or PLC decision based more upon whether the farmer wanted to have more downside price protection (causing them to lean toward PLC) or more downside yield protection (causing them to lean toward ARC-CO) in their title choice. Given the relatively low number of wheat base acres for our Montgomery IL farm, the actual dollar amounts of any wheat payments for this farm would be relatively modest under any scenario. This farmer made their crop insurance selections last September 2023. We’ll assume that they chose an 85% RP policy with no SCO. Therefore, the farmer is free to select either ARC-CO or PLC. However, if the farmer had selected a crop insurance policy using SCO last September, that farmer would be limited to selecting PLC for title for the wheat base acres.
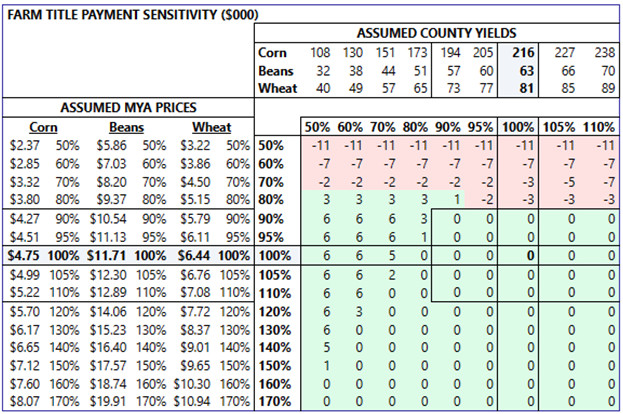
Total Farm Title Payments
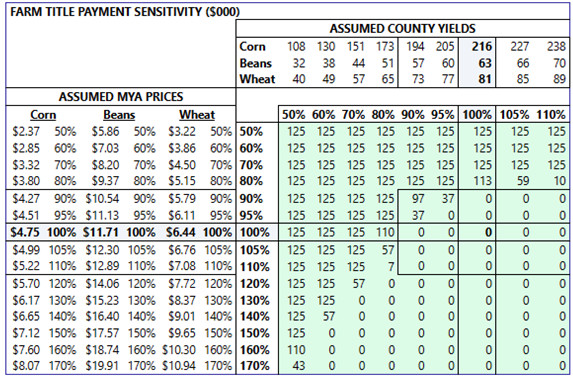
If this Montgomery, IL farmer chose ARC-CO for corn, ARC-CO for soybeans and PLC for wheat, the following whole farm title payments that would be made at various combinations of county yields and MYA prices are shown in the following table.
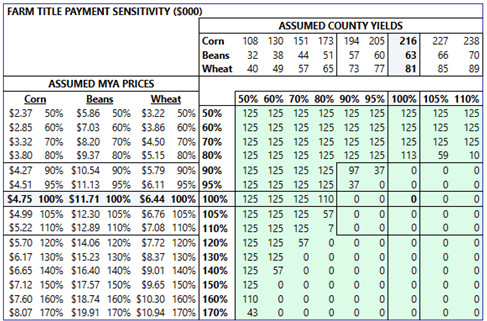
Recall that there is a $125k cap on the TOTAL of all ARC-CO and PLC payments in any given crop year for each “eligible entity” for FSA purposes. For this Montgomery County farm, we assume that it has only one “eligible entity” for FSA purposes. That explains why, in the table above, the $125k figure appears across the table. The combined payments in those instances have exceeded the $125k cap. If this farm had two (instead of one) “eligible entities” then it would be subject to a $250k total cap on combined total ARC-CO and PLC Payments.
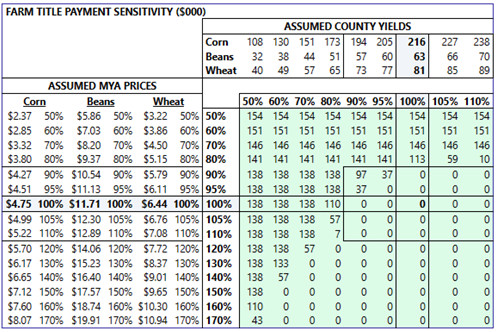
The number of “Eligible Entities” available to a farm operation is dependent on the corporate structure of the farm, and the roles of the owners and operators. This designation is subject to multiple complex rules. For example, a farm structured as a C-Corporation would be deemed to have one “eligible entity”. By contrast, a farm structured as a General Partnership with two family members owning the partnership interests and both involved with the farming operation would almost certainly qualify for 2 “eligible entities” and would therefore be subject to a $250k total cap on payments in a given crop year instead of the $125k cap. The payments to this Montgomery County farm operation if it had 2 “eligible entities” is shown in the table below.
For very large farms with a single “eligible entity” designation, the $125k cap can come into play very quickly in downside price or yield events. Farmers operating multiple FSA farms are allowed to elect one FSA farm’s title acres of a specific crop to PLC and another FSA farm’s title acres of that same crop to ARC-CO. Therefore, both large and small producers operating multiple FSA farms, can consider the possibility of mixing and matching their title elections to hedge their bets rather than putting all base acres of a crop into the same program. This strategy is especially effective if the expected value of the payouts between ARC-CO and PLC are very close to one another or when a farm is very large with only one “eligible entity” cap. Large farm operators may wish to consider changes to their corporate structure to provide for a greater number of “eligible entities” that will subject title payments to a higher cap.
MYA Calculation Detail
The USDA’s MYA calculations are complex and somewhat mysterious. They are not easily understood by most industry participants. In the IFBT model, from the early planning stages of the crop year until May, MYA prices are derived from current futures prices across multiple delivery months across the marketing year plugged into a USDA formula which incorporates three individual variables. These variables include a) the 5-year historical average of the aggregate of U.S. farmer’s grain deliveries by month after harvest, b) the 5-year historical average monthly basis received by farmers nationally, and, c) for wheat, the 5-year weighted average of the relative quantities of production of soft red winter wheat, hard red winter wheat and hard red spring wheat across the US to compute a weighted average MYA price for wheat nationally. As futures prices move up and down, the calculation will produce higher or lower results. The base case MYA used for this analysis is based on market prices as of 1/12/2024. Since relatively little grain contracting will typically have been done by US farmers prior to May, the sensitized MYA prices in IFBT are computed by taking the base case MYA price that is computed by this USDA formula and scaling it up or down proportionately by the price factor in the sensitivity tables.
Using the USDA’s formula described above and the current new crop futures prices across multiple future delivery months as of 1/12/24, the current harvest price for corn of $4.82 translates into a $4.75 estimated MYA price, the harvest price for soybeans of $12.02 translates into an $11.71 estimated MYA price, the harvest price for CBOT soft red wheat of $6.30 translates into a $6.44 MYA price for all wheat.
Beginning in May of each crop year, the USDA publishes monthly MYA estimates for each crop in their WASDE reports. Because this is a better and more precise estimate of the USDA’s expected MYA for the crop year, starting in May and continuing through the remainder of the crop and marketing year, IFBT utilizes these monthly WASDE MYA estimates as the base case for MYA. To compute MYA sensitivities to harvest futures price changes after May, the MYA calculation uses estimated weights of currently marketed grain to un-marketed grain. Therefore, as the marketing year progresses and more marketing is completed by farmers nationally, the IFBT calculation for MYA becomes less and less sensitive to changes in futures prices and more heavily weighted to WASDE’s published MYA. At the end of the marketing year, IFBT’s MYA prices will exactly match the final MYA prices released by the USDA.
ARC-CO or PLC Decision Timing
As farmers know very well, harvest prices can change rapidly and significantly, up or down. It is therefore generally wise for the farmer to make ARC-CO/PLC decisions closer to the March 15th deadline when more price information is known as the probability of the triggering events for PLC and ARC-CO can change. Once a farm’s title related data and initial choices are loaded into the IFBT application, the application automatically updates these screens daily reflecting the most current harvest futures price data. The farmer can easily test the results of the alternative programs by shifting title acres. Therefore, IFBT can very easily provide the farmer with a real-time view as to ARC-CO and PLC decisions specific to their own farm as the March 15th deadline approaches.
Every county has different ARC County Benchmark Revenues for each crop. And each farm has a different number of title acres and PLC yields for each crop. The analysis presented in this blog post was specific to our Montgomery County, IL farm and is current as of 1/12/2024. A farmer using IFBT can easily produce their own title payment sensitivities for their own farm using their own county’s data (which are already downloaded from the FSA and built into the IFBT application) and their own title acres and PLC yields by crop.
Importantly, in IFBT, the ARC-CO/PLC decisions and their payment implications are incorporated into the ENTIRE farm sensitized budget. ARC-CO/PLC decisions represent only a part of a holistic view of the farm’s static budget and overall risk profile under various future unknown price and yield circumstances. The ARC-CO/PLC decision process described to this point in this blog post provides only one of the many valuable components required to produce a fully integrated and sensitized farm budget. How ARC-CO/PLC decisions fit into the overall farm budget and profit risk picture is discussed below.
Using IFBT to Produce a Holistic View of Profitability Under Various Combinations of Price and Yield
In addition to assisting the farmer in making title decisions, the IFBT can help the farmer visualize the entire sensitized farm budget simultaneously taking into account all factors including, costs and variability of costs with final yield, the impact of marketed and un-marketed grain at any moment in time, the farm’s assumed basis and basis sensitivity, crop insurance type and coverage level, land rental arrangements, and the costs associated with owned versus rented land.
We present below an example of how this farmer’s title decisions fit into a holistic view of our Montgomery County farm. We use the following reasonable assumptions for this farm operation:
- For the operator’s 2,000 farmed acres, the farmer plans to plant 900 corn acres, 900 full season bean acres, 200 wheat acres and 200 DC bean acres.
- This farm’s costs of production and yields are assumed to equal those budgeted by University of Illinois for Central IL Low Productivity Rotating corn, full season beans, wheat and dc beans available at https://farmdoc.illinois.edu/handbook/2024-budgets-for-all-regions These budgets are easily selected from a wide range of budgets with a simple click of a drop down menu.
- Cost budgets in IFBT will differ slightly from U of I’s budgets because crop insurance premium costs are calculated by IFBT based upon the farmer’s assumed crop insurance choices. Therefore, IFBT replaces the crop insurance costs in the benchmark budget with those costs calculated based on the farmer’s crop insurance selections.
- The farmer has done no contracting of either futures or basis to date. Based on the farm’s proximity to Mississippi River terminals, the farmer expects +$.20 positive basis to be realized for each crop over the course of the crop year.
- Revenues for uncontracted grain are based upon current harvest futures prices and the farmer’s assumed basis for uncontracted grain. Revenues from contracted grain are based upon the farmer’s actual futures and basis contracts at any point in time as input into IFBT by the farmer. Revenues calculated by IFBT will therefore not match the revenue in the budgets prepared by U of I, but instead will be specific to the farmer’s own operations and specific circumstances and updated daily (for this article as of 1/12/24)
- The farmer selects an 85% RP policy for each crop, approved yields are corn 210, fs beans 65, wheat 80, dc beans 45. For corn and beans, crop insurance projected harvest price equals the current harvest price and volatility is assumed to equal 2023 volatility for purposes of calculating premium payments. For wheat, the actual final discovered projected price and volatility of $6.72/b and .25 are used as those are known.
- The farmer places 975 corn title acres into ARC-CO, 925 bean title acres into ARC-CO and 150 wheat title acres with 65 PLC yield into PLC
- The farm has one “eligible entity” for purposes of the $125k cap on title payments. A 6.2% “sequester” deduction is assumed to be applied to the calculated ARC-CO and PLC payments.
- 100% of the 2,000 farmed acres are cash rented (with no owned land and no variable cash rent)
- The farm has no non-farm, non-grain revenues or expenses.
- IFBT's estimated percentages of 16%, 14%, 12% and 16% are utilized for non-land costs that vary with yield for corn, fs beans, wheat and dc beans respectively (for estimated drying, hauling, storage, and replacement-based P&K fertilizer),
- County yields are assumed to equal farm yields for determining final county yields for title calculations and for any county based crop insurance selections.
Using these assumptions, IFBT computes revenues, a static complete budget, as well as sensitivity analysis as of 1/12/24 for the farm based on an array of potential future harvest prices and crop yields. The buildup of that crop year budget and sensitivity analysis are presented below.
Farm Revenue Screenshot from IFBT as of 1/12/24
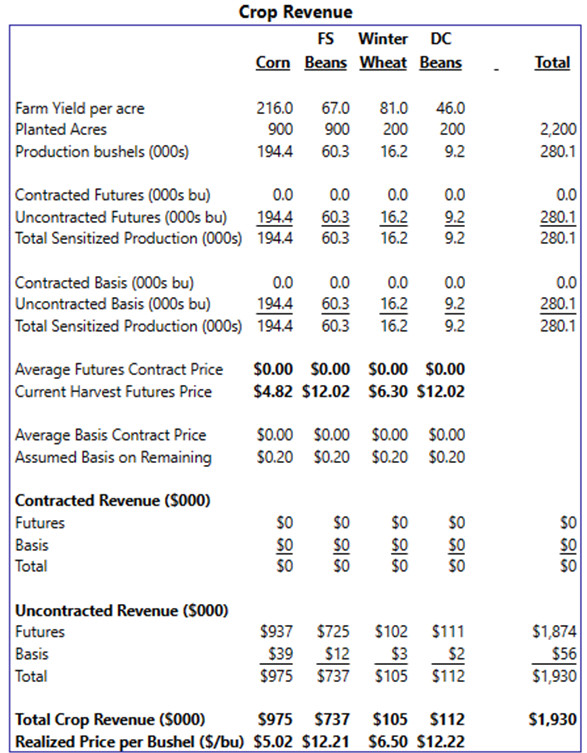
Production bushels are simply the projected base case yields multiplied by planted acreage. Since the farmer has not contracted any grain on either futures or basis, this farmer’s revenue simply equals the farmer’s assumed production bushels multiplied by current harvest price plus 20c positive basis for each crop. For this farmer that revenue figure would total $1.930 million. If futures or basis contracts were already in place, the farmer would enter those contracts into IFBT and the revenues associated with those contracts would become fixed and no longer vary with harvest futures price changes.
Static Pre-Tax Cash Flow Budget as of 1/12/24
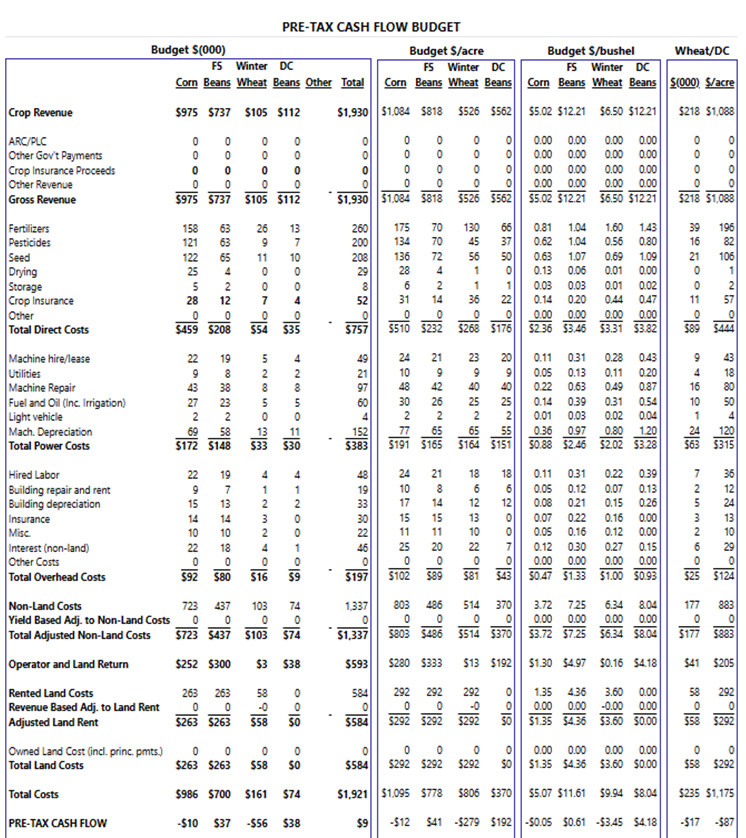
Taking the calculated anticipated revenue of $1.930 million and deducting all of the costs of production including land costs produces an estimated $9k of positive pre-tax cash flow for this operator.
From the table above, corn contributes -$12 per acre, FS beans contribute +$41 profit per acre, and wheat/DC beans combined contribute -$87 profit per acre. When multiplied by planted acres, corn contributes -$10k, fs beans contribute +$37k, wheat and DC beans combined contribute -$18k (the sum of -$56k and $38k) as shown above. The sum of contributions of these three crops equals the total of $9k pre-tax cash flow. No indemnity payments would be made, and no title payments would be made at current prices and anticipated yields.
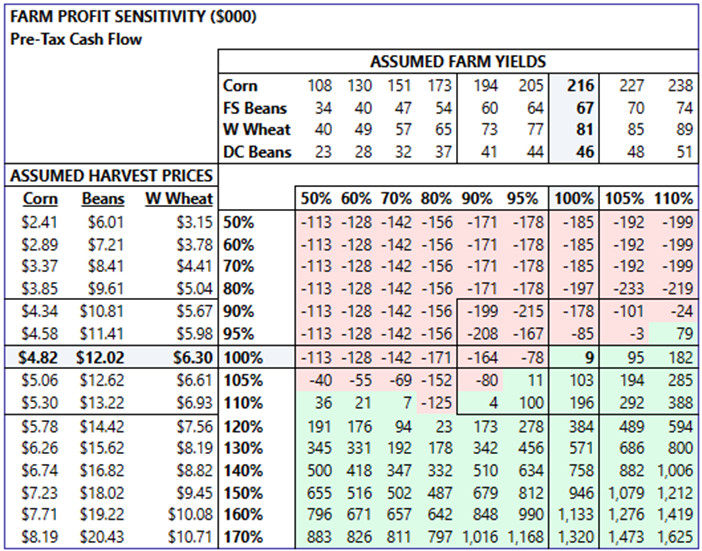
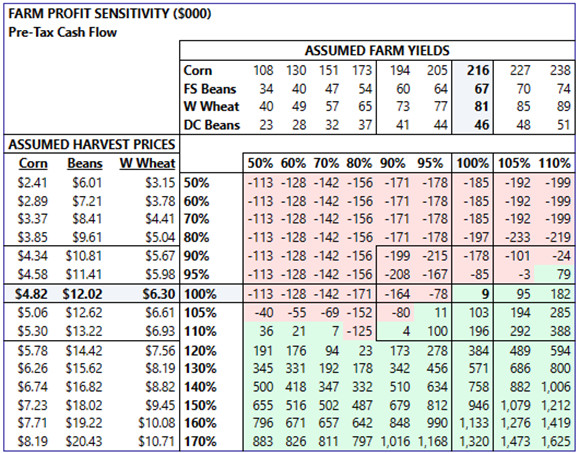
Sensitivities to Changes in Harvest Prices and Yields as of 1/12/24
Farm Pre-Tax Cash Flow
This table represents the single most important contribution of IFBT. It allows the farmer to visualize the farm’s profitability across a wide range of unknown future prices and yields. In the base case (at the intersection of 100% price and 100% yield) the $9k of farm profitability appears. The sensitivity table surrounding this base case result shows the combined impact of all factors described individually below that determine the farm’s pre-tax cash flow.
Components that Sum Up to Produce Sensitized Farm Pre-Tax Cash Flow
Farm Grain Revenue

Farm grain revenue in this example is simply sensitized harvest futures price plus assumed basis multiplied by sensitized production bushels. Had this farmer contracted futures or basis, revenues related to those contracts would be locked in place and only the uncontracted grain would be subjected to harvest price variability. This farmer has not yet contracted any futures or basis.
Farm Costs
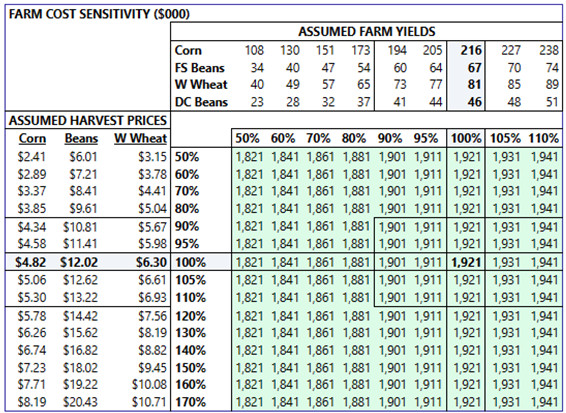
Based upon the assumed variability of non-land costs with yield, a 50% reduction in yield for all crops would result in an approximate $100k (or 5%) reduction in total costs. If the farmer had a variable land rent arrangement with the landlord based upon shortfalls or outperformance on revenues (a feature available in IFBT) then land costs would also vary with price. However, since this farmer has a 100% cash rent arrangement with the landlord, costs will only vary with yield (and not price).
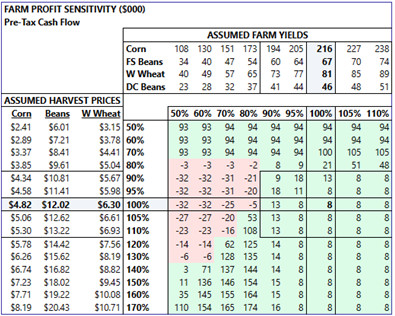
Title Payments
These are the title payments shown earlier that result from changes in MYA prices and county yields. Recall that this operator elected corn and bean title acres to ARC-CO and wheat title acres to PLC. Title payments represent a free form of crop insurance that help protect the farmer against declines in prices and yields.
Crop Insurance Indemnity Payments
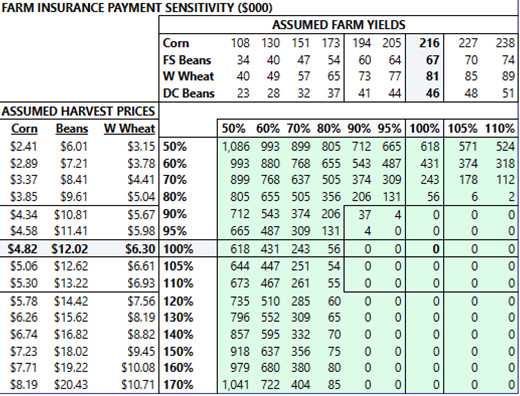
This table shows the indemnity payments that would result from an 85% RP policy for each of corn, soybeans and wheat. The farmer could easily test various crop insurance alternatives by adjusting policy type (RP, RP-HPE, YP) with or without SCO (to 86%) and ECO (90% or 95%) and adjusting base policy coverage levels (50% - 85%). Both premium prices and indemnity payments are calculated by IFBT using RMA’s 2024 actuarial data. If the farmer selected a lower level of coverage, base case profitability would be higher due to the lower crop insurance premium. However, the indemnity payments resulting from shortfalls in prices and/or yields would be reduced. Government crop insurance is highly subsidized by the US government. Therefore, over the long term, the farmer has an approximate 50% “house edge” and a large positive expected value from purchasing crop insurance.
Concluding Thoughts on What Appears to be a Difficult 2024 Crop Year and Possible Action Plan
Unlike the 2021 and 2022 crop years, 2023 and 2024 crop years will be exceedingly challenging for most farmers in the absence of a significant positive change in grain prices. Large increases in prices have happened in the past which can rapidly change the farm profit picture from bleak to rosy. Nevertheless, using our Montgomery, IL farm as an example, profits are currently anticipated to be very low by historical perspective. Many farmers across the country in lower productivity areas and with negative basis are currently anticipating very substantial losses on corn, soybeans, and wheat. The picture for this Montgomery IL farmer is considerably more positive compared to many other producers across the country. However, looking at the Montgomery County farm profit sensitivity analysis (table repeated from above), it is evident that this farmer still faces substantial financial risk in the event of shortfalls in prices or yields.
What can this farmer do to help mitigate risk and improve the profit picture?
Consider Acreage Shifts: As we saw in the budgets, soybean profitability is projected to be $53/acre greater than corn. Soybeans were expected to generate +$41/acre vs. -$12/acre for corn. The farmer may want to shift some acres to beans over corn to enhance returns. There are logistical and agronomic concerns that might arise from such a shift. Therefore, these decisions should not be taken lightly. But if the operator were to take this approach, it is critical that the farmer also sell a portion of the anticipated soybean crop to lock in those expected enhanced profits and that profit differential of beans over corn. Far too often farmers will make planting decisions based on expected profitability, but then do not take steps to lock in that profitability through grain contracting. Since all farmers across the US and globe see the same price signals, overall planted acres often shift to the more profitable crop. Then, due to higher anticipated production for the more profitable crop, the prices for that crop fall. And that crop’s relative advantage disappears. Shifting acres to bring up farm expected profitability combined with locking in some grain sales could be of some modest benefit to the farmer in a difficult year such as 2024 looks to be.
Consider Higher Crop Insurance Coverage: The farmer could buy up higher levels of crop insurance using SCO and ECO. This would modestly reduce base case profitability by the incremental premium costs. But it would also provide much better nearby protection to yield and price shortfalls. SCO and ECO supplemental policies sit on top of traditional farm-based policies. Unlike farm-based revenue protection policies, SCO and ECO policies’ indemnity payments arise when county revenue falls short of county benchmarks (instead of farm revenue falling short of farm benchmarks). Therefore, it is important that the farm’s yield performance is reasonably well correlated with the county’s performance. But if the farmer felt confident in that correlation, this approach may make sense to help shore up nearby risk resulting from reductions in prices or yields.
Consider a Change in the Mix of Coverage: The farmer might also investigate the possibility of reducing the farm’s RP coverage level (in our example RP 85%) to a lower level (say 70%) and then using SCO and ECO to take coverage up to the 90% level. This would have the effect of replacing considerably more expensive farm-based protection with lower cost county-based SCO and ECO coverage while also increasing overall protection. The farmer may find that this shift would provide the higher 90% overall level of revenue protection at a lower cost than an 85% RP policy. For our Montgomery County IL farmer this shift would save the farmer $8k in premium while gaining 5% additional revenue protection. Disadvantages to this approach include the potential for dis-correlation in yields ---where the farm’s yields are poor but the county’s yields are good. In addition, SCO and ECO indemnity payments are paid later than traditional farm-based RP policies (in July after harvest instead of immediately after harvest). Prevent plant coverage is also based on the lower RP coverage levels and therefore provides less protection. Finally, choosing SCO would require our farmer to shift title acres for corn and beans into PLC instead of the farmer’s preferred alternative ARC-CO. Despite these counter arguments, a change to crop insurance protection from RP 85% to, for example, RP 70% plus SCO/ECO 90% might make sense, especially for the large farmer whose operations are spread out in the county. The combined effect of changing crop insurance policy choice to a 70% RP ECO/SCO 90% policy and putting corn and bean title acres into PLC instead of ARC-CO would result in $8k lower premiums and the following modified risk profile for the farm. A side-by-side look at the two approaches is shown in the sensitivity tables below.
RP 70% + ECO/SCO 90% RP 85%

Difference: Benefits of RP 70% + ECO/SCO 90% over RP 85%
Contract Some of the New Crop: The farmer could contract futures or basis to help mitigate downside price risk to futures or basis (albeit giving up proportionate upside opportunity). Although it is very difficult psychologically for the farmer to contract grain at current depressed values, prices can fall significantly from current levels and expose the farmer to considerable downside price risk before title and crop insurance payments trigger. Locking in some of the projected crop at breakeven or modest profitability could help shield the farm from the potential of devastating downside financial risk.
Adjust Land Rental Arrangements: The farmer could have discussions with the landlord relating to reductions in land rent (often very difficult) or alternatively suggest a variable cash rent arrangement that would provide some nearby downside protection to the farmer (in exchange for giving up some nearby upside to the landlord).
Examine Costs to Ensure Positive Returns: The low relative profitability expected for 2024 might cause the farmer to want revisit the farm’s cost structure and management practices. Low grain prices relative to prior years could cause the farmer to rationally want to choose to economize on chemicals, fungicides, seed treatment, etc. When grain prices were very high as in 2021 and 2022, incremental costs to drive yield and help ensure high yields made economic sense as the value of that crop was very high. But the converse of that is also true. In years with very low grain prices and high input prices it is critical for the farmer to carefully evaluate which costs are likely to generate a positive net return.
Evaluate Nitrogen Using MRTN: With respect to corn specifically, the farmer might wish to use a Maximum Return to Nitrogen (MRTN) calculator such as https://www.cornnratecalc.org/ to help maximize overall corn returns. Using Central IL as an example, at last year’s $1,400/ton anhydrous price and $6.00 corn price, 204 lb./acre of anhydrous was the optimal application rate (before counting N from DAP). At this year’s $800/ton anhydrous price and a $4.50 corn price, MRTN suggests that a slightly higher 217 lb./acre application rate is optimal for 2024. Of course, many farmers in 2023 applied large quantities of expensive anhydrous expecting $6.00 corn. But they did not contract their expected corn production at the high prices available in the Spring and instead watched as prices fell dramatically over the course of the crop year. Had they known that they would be paying $1,400/ton for anhydrous and then producing corn valued at $4.50/b after harvest, MTRN would have suggested a lower application rate of 189 lb/acre or nearly 10% less. Using MTRN to determine N application rates is smart and highly beneficial. It helps ensure that the last pound of N purchased pays for itself in incremental corn revenues. But farming is ultimately a “spread” game. What is the value of output less the costs of inputs? Therefore, matching the revenue side (grain contracting) with the cost side (buying inputs) is a critically important risk management tool for the farmer to lock in a profitable spread and to avoid margin squeezes relating to declining grain prices like those that occurred over the 2023 crop year.
Review Fertilizer Replacement Rates: To the extent that the farmer has not yet adopted the most recent fertilizer replacement rates recommendations from academic institutions (which are lower than previous recommendations), the farmer may decide to implement those changes to economize on P & K fertilizer costs without anticipated yield loss. And although P & K prices have come down from recent highs, they remain at historically elevated levels. As these fertilizers remain in the soil for multiple years, the farmer may wish to reduce application rates following the 2024 crop with the intention of “catching up” in subsequent years when farm profit conditions are better and P & K prices are potentially lower.
Forego Equipment Purchases: The farmer may also wish to limit spending on new capital equipment in this high interest rate, high equipment cost environment. And instead try to do their best to get by with the existing complement of equipment (albeit at likely higher repair costs). As demand for equipment falls pressuring new equipment prices and if interest rates fall, farmers may be able to achieve much better value by delaying large equipment purchases.
Manage Living Expenses and Consider Non-Farm Income: Farmers may also want to take a hard look at living expenses and limit discretionary spending while also considering whether there might be opportunities for family members to supplement farm income with off-farm employment.
Evaluate Changes to Farm Ownership Structure: Smaller farmers generally do not see the total of all title payments exceed the $125k cap in any given year. Large farmers with single “eligible entities” however can hit those caps fairly quickly. Modifying the farm’s corporate ownership to increase the number of “eligible entities” can increase the cap and cause higher title payments to be made in downside price and yield scenarios. As noted earlier, 2024 title payment triggers are much “closer to the money” than they were in 2023. These trigger points will continue to increase to the benefit of the farmer as it relates to title payments in the 2025 crop year. Therefore, farmers may wish to consider ways to re-incorporate into partnership or other legal structures which, under certain circumstances, can increase the number of “eligible entities” and result in higher caps on title payments. In addition to title payments, ad hoc subsidy payments have, in the past, also had caps imposed based upon the number of “eligible entities”. Therefore, to the extent that low farm incomes might result in additional ad hoc governmental subsidies, large farmers have an additional incentive to consider mechanisms to increase their “eligible entities”.
Pay Attention to the Cost of Capital: In a high interest environment the farmer should carefully calculate the pros and cons of storing grain. The farmer should ask themselves whether the chances that storing and carrying un-marketed grain in the hopes of higher grain prices outweighs the benefits of turning that crop into cash today. In a high interest and generally oversupplied grain environment, holding substantial un-marketed grain is both risky and costly. The ability to reduce high interest costs on debt or earn high interest on cash can materially change the risk/reward equation relative to prior years when interest rates were very low.
Have a Marketing Gameplan: Grain marketing is very difficult for most farmers. Establishing a gameplan upfront to help ensure that costs are at least somewhat matched with revenues and grain is systematically sold over the course of the crop year is an important discipline. By definition, the farmer starts the year with a very long grain position. That position needs to be flat at the end of the marketing year or earlier depending on the availability of storage. Laying out the substantial upfront costs for a crop without any plan for realizing revenues is a very risky game. Getting distracted or busy is not an excuse for poor marketing. Marketing is probably the single most important driver of a farm’s profitability and risk profile. Shooting from the hip, significantly over-contracting or under-contracting, assuming that you can beat the markets, or assuming that you can time the markets are all fool’s errands. A systematic approach to marketing will remove the emotion (joy, regret, guilt, paralyses) and result in consistent good outcomes. If you have a marketing approach that generates extraordinary results in any given year, your marketing plan is almost certainly reckless and not repeatable and will likely result in terrible results in future years. Systematically spreading out grain sales over time and trying to be average or perhaps slightly above average is a good plan for survival in the very difficult business of farming.
Communicate with Lenders and Other Key Constituents: Farmers should proactively reach out to their lenders and other key partners to demonstrate to them that they have a deep knowledge of their own cost structure and a laser focus on the farm’s financial performance. This will build credibility and engender trust. Developing and sharing benchmark and customized farm crop year budgets, showing the lender the ways in which you are managing your financial risk profile, sharing your farm’s profit sensitivities to unknown future prices and yields, will go a very long way to demonstrating your financial literacy. These communications will help the farmer avoid negative surprises and create a positive long term working relationship with lenders and others. This is especially important as the farm enters into a very difficult financial environment.
Weed the Garden: Selling off underutilized assets, eliminating unprofitable side businesses, focusing intensively on costs, and cleaning up wasteful spending or inefficient activities are all steps that can help the farmer improve cash flow and profitability to weather a rough patch.
Conclusion
The recent sharp declines in grain prices, if sustained, will place significant profit pressure on farmers carrying old crop uncontracted 2023 grain as well as for farm profitability prospects for the 2024 crop year. Those farmers having a very good understanding of their costs of production and using the risk management levers available to them to protect against significant downside exposure is especially prudent entering into what appears will be a highly difficult and uncertain environment.
IFBT.Farm
IFBT is a budgeting and risk management tool for corn, soybean and wheat farmers across the U.S. It allows farmers to easily produce benchmark and customized farm budgets for a crop year. It also allows farmers to visualize the financial risks to their farm resulting from deviations in budgets relating to changes in unknown future prices and unknown actual farm crop yields. The application simultaneously integrates and models the impact of all of the varied choices that farmers can make to manage and mitigate financial risk. These include crop acreage allocations, crop insurance choices, title selection, grain marketing, land rental arrangements, among others. IFBT produces static budgets that are updated daily over the course of the crop year. It also produces sensitivity analyses that provide the farmer with a comprehensive view of their financial risk profile both entering a crop year and on an ongoing basis throughout the crop year. The information produced by the application provides farmers with the ability visualize potential future outcomes and proactively adjust their decision-making to mitigate and manage financial risk. The IFBT application is now available to farmers to assist with 2024 crop year planning, budgeting and risk management decisions for producers of corn, soybean and wheat across the US. The application is free for use and can be accessed at www.ifbt.farm
More Posts
- Deere Q1 Earnings Boosted 70c by One Time Items (Feb, 25)
- Deere Stock is Vulnerable (Aug, 24)
- Ag Profit Decline and Possible Impact on Deere Shares (Jan, 24)
- Corn and Soybean 2024 Projected Losses (Jan, 24)
- 2024 Cost of Production and Breakeven Harvest Prices (Dec, 23)
- Hiding in Plain Sight - Part 2 (Dec, 23)
- Hiding in Plain Sight (Dec, 23)
- Clearing out the Cobwebs (Nov, 23)
- From Joy to Despair (Nov, 23)