2024 Cost of Production and Breakeven Harvest Prices
Corn and Soybeans as of 12/28/2023
Summary Conclusions:
Eight universities have released their 2024 crop year budgets for corn and soybeans. At current harvest prices, neither soybeans nor corn revenues are expected to exceed the total costs of production for the average farmer causing both crops to be projected to be unprofitable for the 2024 crop year.
Corn budgets project an average loss of $59/acre.
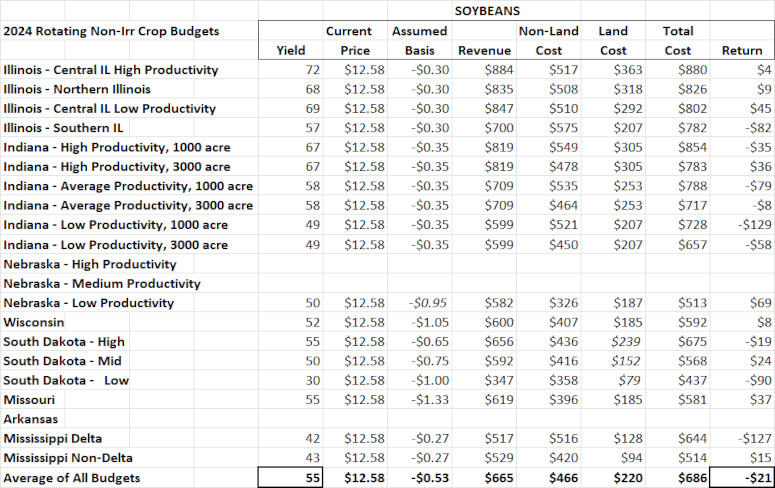
Soybean budgets project an average loss of $21/acre
Corn is expected to be $38/acre less profitable than soybeans.
Breakeven harvest futures prices required for the average farmer equals:
- Corn: Dec 24 futures price of $5.39. Up $.34 or 6.7% over the current trading price of $5.05.
- Soybeans: Nov 24 futures price of $13.09. Up $.51 or 4.1% over the current trading price of $12.58
Of the 21 published 2024 corn budgets, only 4 are expected to produce profitability while 17 are expected to produce losses.
Of the 18 published 2024 soybean budgets, 9 are expected to produce profitability while 9 are expected to produce losses.
Farms on higher productivity soils that have higher expected yields tend to have higher budgeted returns than farms generating lower expected yields for each of corn and soybeans.
Data and Analysis:
This article presents the reader with a graphical representation of total costs of production as well as breakeven prices for each of these budgets. Cost data includes ALL of the costs of production in measuring 2024 farm year projected profitability. This includes all direct costs of production, all farm overhead costs and includes estimated land costs. We include only budgets for rotating non-irrigated corn and soybeans.
The budget sources including their authors and academic institutions can be accessed at the attached links.
- Illinois: 2024 Budgets For All Regions - farmdoc (illinois.edu)
- Indiana: https://ag.purdue.edu/commercialag/home/resource/2023/11/2024-crop-cost-and-return-guide/
- Nebraska: Nebraska Crop Budgets | CropWatch (unl.edu)
- Wisconsin: https://cropsandsoils.extension.wisc.edu/article-topic/economics-budgets-financial/
- South Dakota: https://extension.sdstate.edu/crop-budgets
- Missouri: Missouri crop and livestock enterprise budgets | MU Extension
- Arkansas: https://www.uaex.uada.edu/farm-ranch/economics-marketing/farm-planning/budgets/crop-budgets.aspx
- Mississippi: https://www.agecon.msstate.edu/whatwedo/budgets.php
In several cases, university budgets exclude specific items (expected revenue, basis and land costs) that are necessary to compute projected profitability and breakeven prices. To produce an estimate of revenue and assumed basis, we take the date of the budget’s release and using the harvest futures prices that were available on or around that date, we impute the basis that was used in the budget model. In certain cases, we calculate an average basis from USDA reports for the appropriate areas within that state. In budgets in which land costs are not included, we use averages of USDA reported land rental costs for the relevant areas within that state.
Corn Budgets:
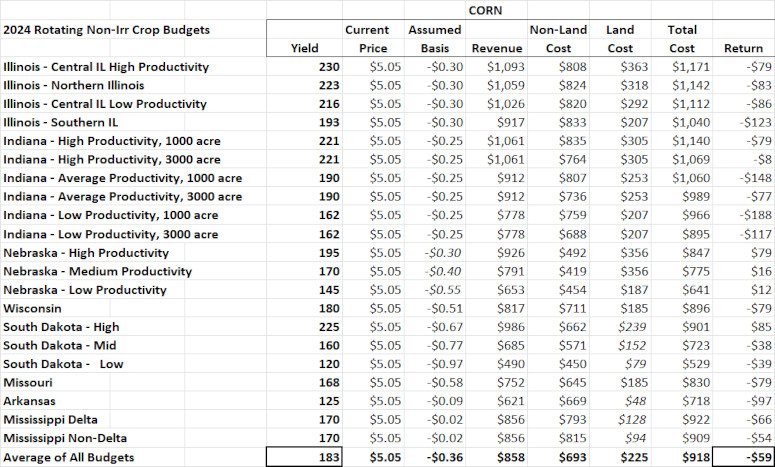
As demonstrated below, we show key elements of the 21 corn budgets from the agricultural economics and extension arms of academic institutions from 8 individual states. The average yield for these budgets is 183 b/acre and the average return/acre at current harvest price is -$59/acre. Only 4 corn budgets show operator profitability at the current harvest price for corn of $5.05/bushel while the remaining 17 corn budgets project a loss.
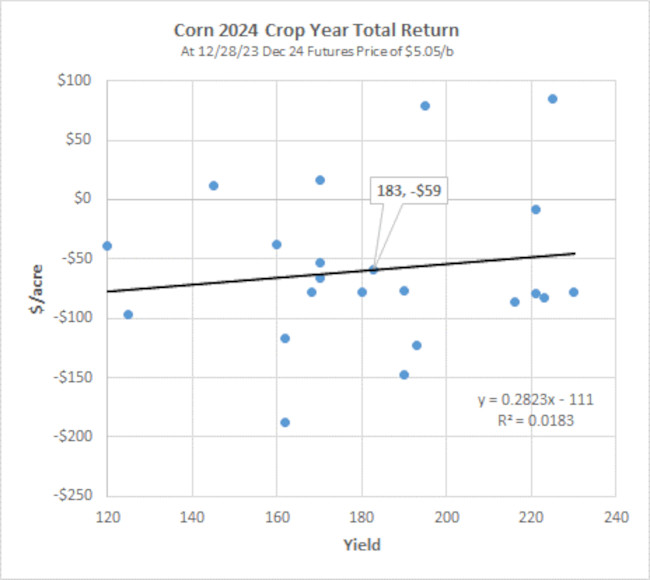
The graphic below shows a scatter plot of these 21 budgets. The average yield of 183 and average return -$59/acre are called out on the chart. Only 4 data points are above the breakeven $0/acre level on the Y axis while 17 are below that $0/acre breakeven. There is considerable variation in expected returns at current harvest prices across these university budgets with some budgets projecting much higher returns than others. As the upward sloping line in the graphic below indicates, there tends to be a small positive correlation in which higher expected yields are correlated with higher anticipated profitability. Therefore, higher yielding farms will tend to generate higher returns than lower yielding farms at any given price. Higher yielding farms will tend to have lower required prices to generate a breakeven result than lower yielding farms.
The following table shows a scatter plot of the harvest futures prices that are required for breakeven for each of the 21 corn budgets. The average yield from the universe of budgets is 183 b/acre and the average breakeven price is $5.39/bushel, or $.34 above current harvest trading prices of $5.05/bushel.
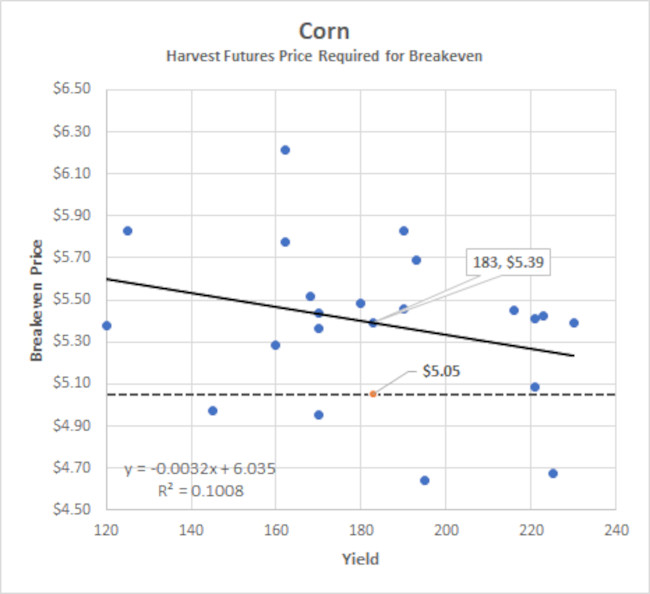
CORN HARVEST FUTURES PRICE CHART
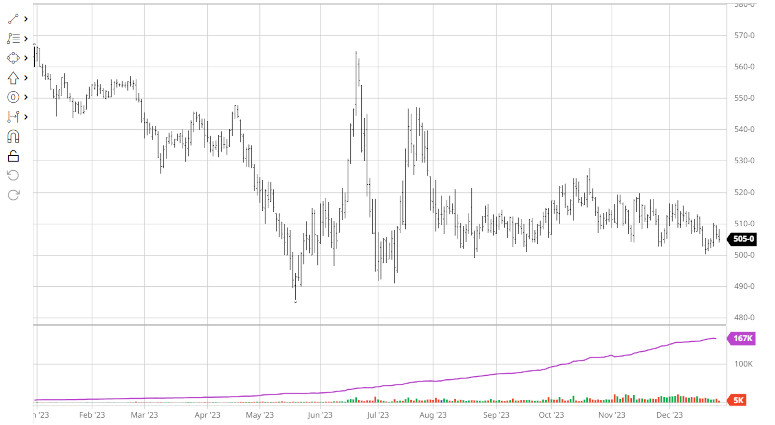
At $5.05/bushel, current harvest prices are well below the $5.39/b breakeven harvest price. Corn traded above breakeven levels several times over the last 12 months, most recently in June and July 2023.
Soybean Budgets:
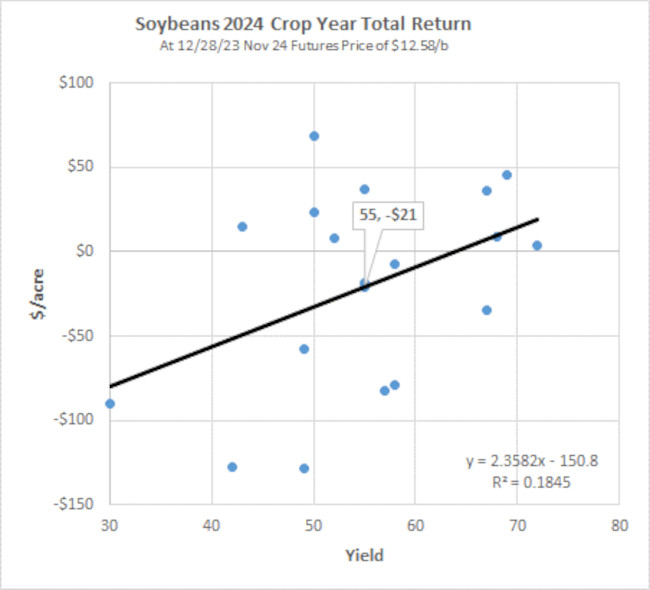
As demonstrated below, we show key elements of the 18 soybean budgets from the agricultural economics and extension arms of academic institutions from 7 individual states. The average yield for these budgets is 55 b/acre and the average return/acre at current harvest price is -$21/acre. 9 soybean budgets show operator profitability at the current harvest price for soybeans of $12.58/bushel with the remaining 9 soybean budgets project a loss.
The graphic below shows a scatter plot of these 18 budgets. The average yield of 55 and average return -$21/acre is called out on the chart. Nine data points are above the $0/acre breakeven level on the Y axis with nine data points falling below that $0/acre breakeven level. There is considerable variation in expected returns at current harvest prices across these university budgets with some budgets projecting much higher returns than other budgets. There tends to be a small positive correlation in which higher expected yields are correlated with higher anticipated profitability. Therefore, as with corn, higher yielding farms will typically tend to generate higher returns than lower yielding farms at any given price. Higher yielding farms will tend to have lower required prices to generate a breakeven result than do lower yielding farms.
The following table shows a scatter plot of the harvest futures prices that are required for breakeven for each of the 18 soybean budgets. The average yield from the universe of budgets is 55 b/acre and the average breakeven price is $13.09/bushel, or $.51 above current harvest trading price of $12.58/bushel.
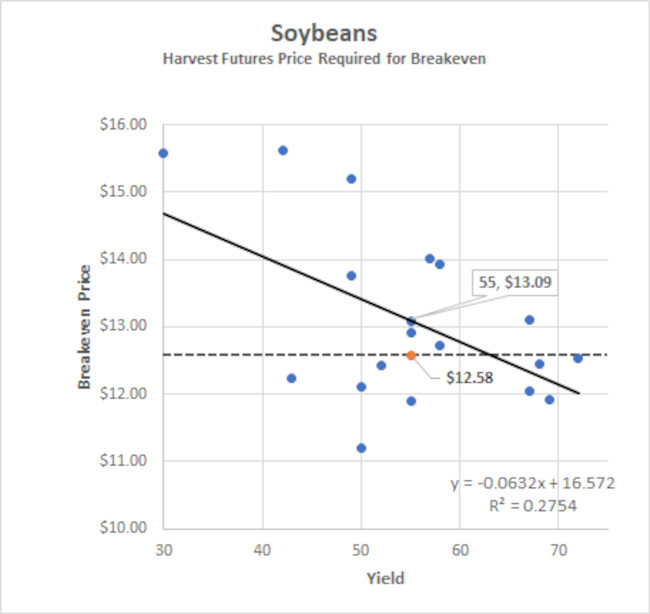
SOYBEAN HARVEST FUTURES PRICE CHART
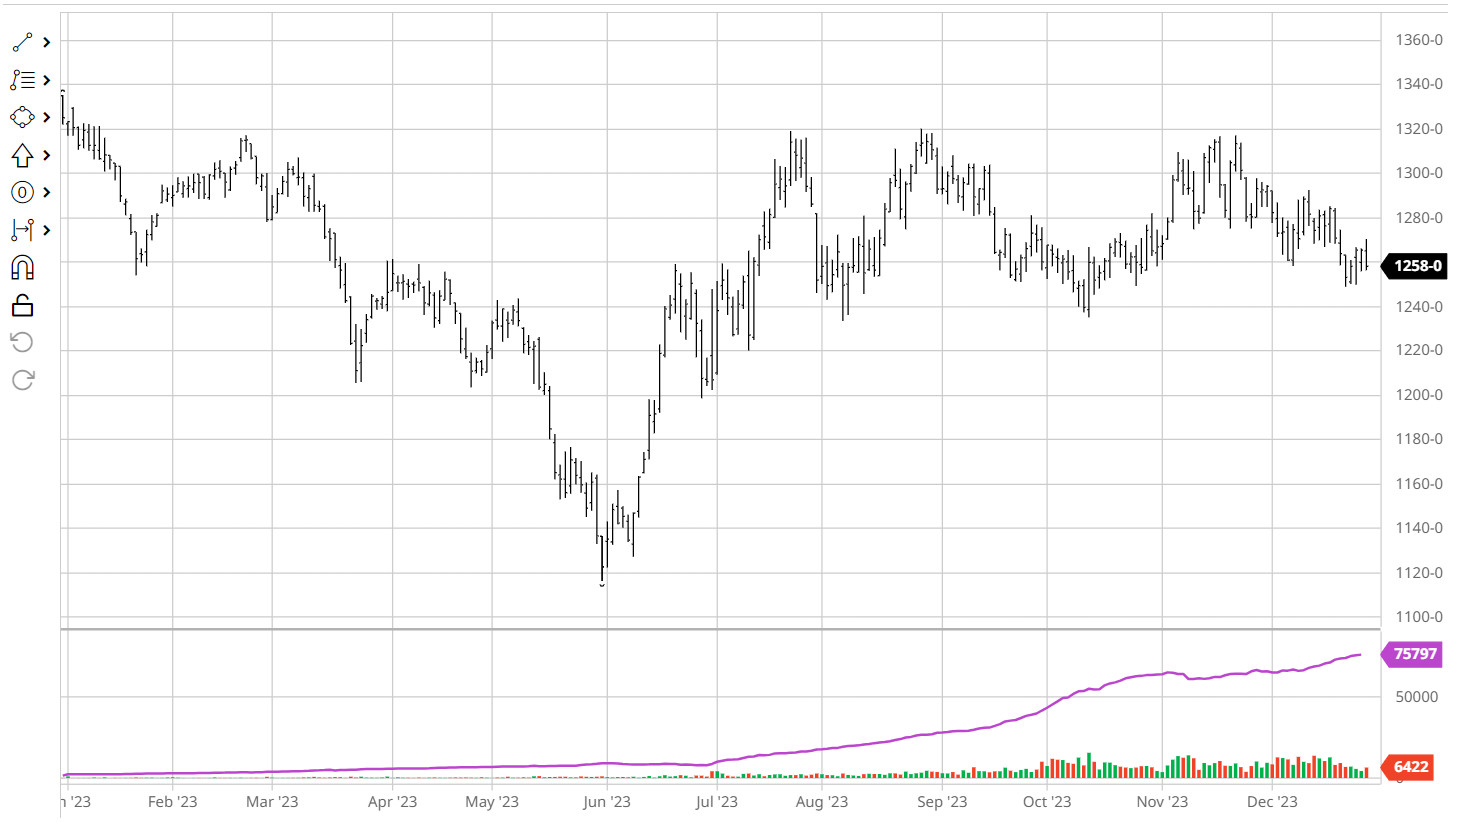
At $12.58/bushel, current harvest prices are well below the $13.09/b breakeven harvest price. Soybeans traded above breakeven levels several times over the last 12 months, most recently in July, September and November 2023.
IFBT.Farm
The online web application IFBT.Farm is a budgeting and risk management tool for corn, soybean and wheat farmers across the U.S. It allows farmers to easily produce benchmark and customized farm budgets for a crop year. It also allows farmers to visualize the financial risks to their farm resulting from deviations in budgets relating to changes in unknown future prices and unknown actual farm crop yields. The application simultaneously integrates and models the impact of the choices that farmers can make to manage and mitigate financial risk. These include crop acreage allocations, crop insurance choices, title selection, grain marketing, land rental arrangements, among others. Importantly, as it relates to grain marketing, the application allows users to manage their futures and basis contracts and test sensitivities of overall farm financial performance to changes to harvest futures prices or changes in actual realized basis. These sensitivity analyses provide the farmer a comprehensive view of their financial risk profile entering a crop year and allow the farmer to proactively adjust their decision-making to mitigate and manage financial risk.
The IFBT.Farm application currently supports the 2023 crop year. Beginning on January 1, 2024, the IFBT.Farm application will also support farm planning and budgeting for the 2024 crop year for corn, soybean and wheat farmers across the United States. The application can be of great assistance to farmers who wish to understand the implications of their crop acreage allocations, crop insurance selections, title selections, and grain marketing approaches on their financial results--- all critical decisions that must be made relatively early on in the crop year. The application is free for use and can be accessed at www.ifbt.farm
More Posts
- Deere Q1 Earnings Boosted 70c by One Time Items (Feb, 25)
- Deere Stock is Vulnerable (Aug, 24)
- Ag Profit Decline and Possible Impact on Deere Shares (Jan, 24)
- Corn and Soybean 2024 Projected Losses (Jan, 24)
- 2024 ARC-CO PLC Decisions Using IFBT (Jan, 24)
- Hiding in Plain Sight - Part 2 (Dec, 23)
- Hiding in Plain Sight (Dec, 23)
- Clearing out the Cobwebs (Nov, 23)
- From Joy to Despair (Nov, 23)