From Joy to Despair
Lessons Learned from the 2023 Crop Year
At the start of the 2023 crop year, corn and soybean farmers across the central U.S. were anticipating another superb year of profitability following very good 2021 and 2022 crop years.
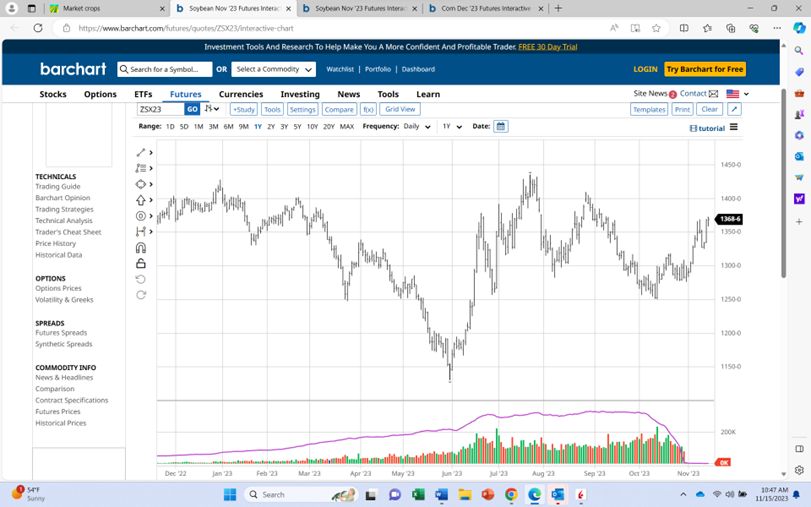
During the early planning phases of the crop year in mid-January 2023, both corn and soybean prices remained near multiyear highs. As shown in the charts below, in mid-January of 2023, harvest futures for corn and beans were trading at around $6.00/bushel and $14.00/bushel respectively. At that time a typical farmer would have anticipated strong profitability for both corn and soybeans, with corn looking to be significantly more profitable than beans.
Corn Dec 23 Futures

Soybean Nov 23 Futures
Using the IFBT application, let’s take a look back on the 2023 crop year for a typical farmer in Central Iowa. To do this let’s first start with some reasonable assumptions. We’ll assume a farm operation with 2,000 total production acres of which 1,000 acres are planted to corn and 1,000 acres are planted to beans in rotation. Assuming a normal growing season, this central Iowa farmer anticipates achieving trend yields of 202b/acre for corn and 59b/acre for soybeans. They buy an 80% RP crop insurance policy for both corn and beans, and elect the farm’s title acres for both corn and beans into ARC-CO. We’ll assume that in mid-January they have not yet marketed any of the 2023 crop year’s anticipated production and expect to receive basis consistent with past years equal to -$.30 for corn and -$.70 for beans. This farmer believes that the farm’s costs of production are in line with budgets produced by Iowa State University for medium productivity farms available at https://www.extension.iastate.edu/agdm/crops/pdf/a1-20-2023.pdf
Using the IFBT application, on January 15, 2023, this farmer would have anticipated whole farm revenue of $1.929m and farm profitability of $267k, with $181k coming from corn and $86k from soybeans.
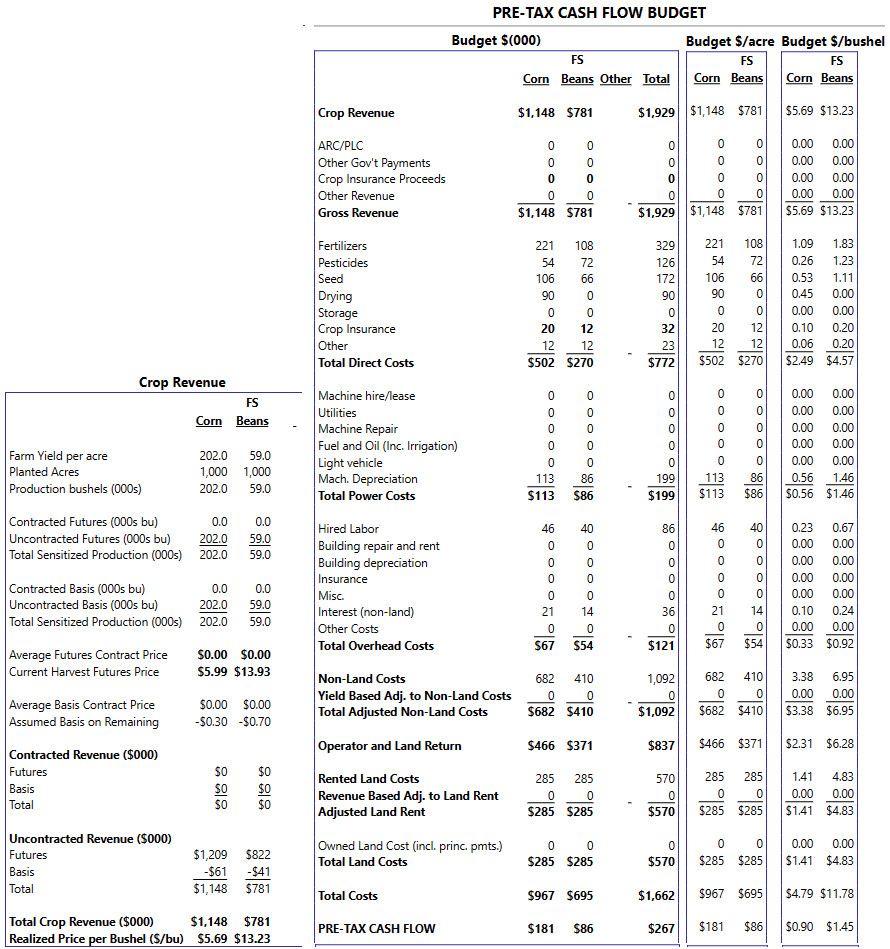
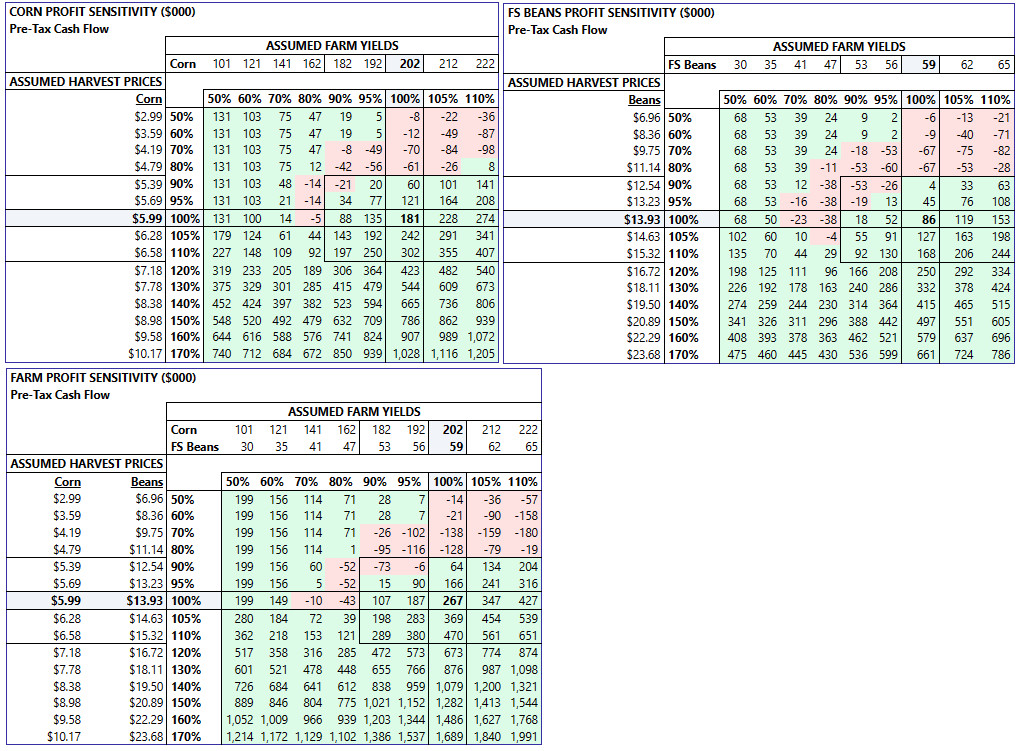
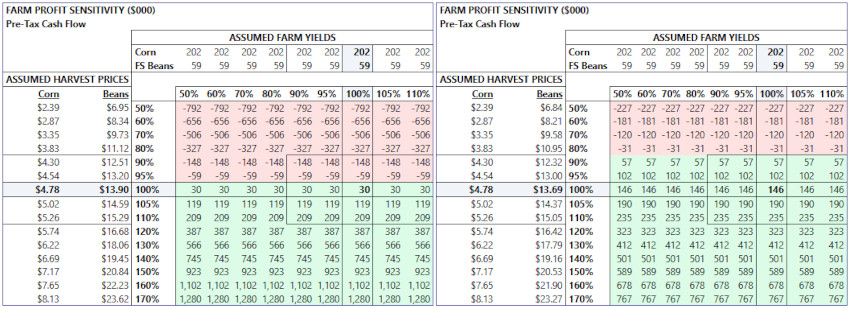
The images below produced by the IFBT application show the farmer’s base case projected profitability (at the 100% yield and 100% price center point) as well as the farm’s profit risk profile to changes in prices and yields as of that January 15th date. Note that in addition to sensitizing profitability for prices and yields, these sensitivity tables produced by the IFBT application also take into account, 1) both the premium costs and the indemnity payments from crop insurance, 2) compute and include any title payments that would be made based on various combinations of prices and yields, and 3) adjust operating costs upward or downward to reflect the modest impact on total operating costs related to excess or shortfalls in yields relative to expectations.
From the pictures below, the farmer would see that base case profitability at $181k for corn, $86k for beans and the sum of those two for the whole farm of $267k is a reasonably attractive outcome from a historical point of view. However, relatively small declines in prices or yields would materially reduce profitability. By contrast, relatively small increases in prices or yields would materially increase profitability.
SCENARIO 1
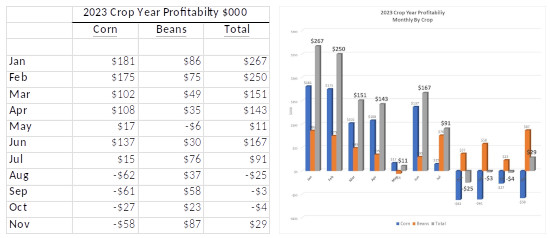
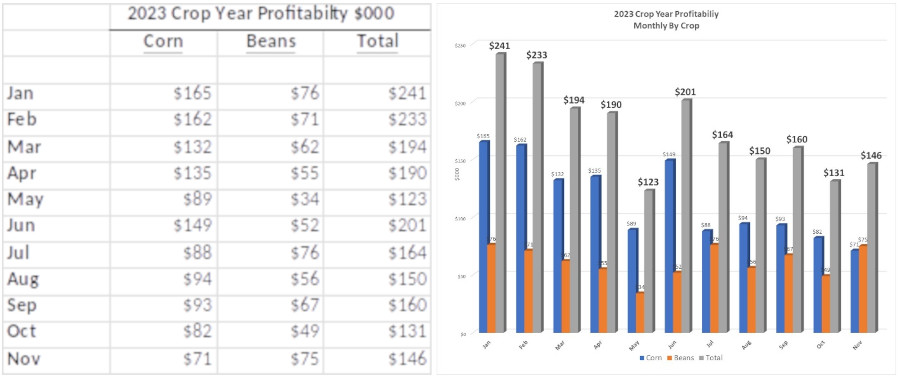
Now let’s look at the profitability for this farmer on a monthly basis across the course of the actual 2023 crop year assuming that they, in fact, achieve the projected 2023 yields and continue not to contract any grain. The pictures below are quite striking. Expected farm profitability declined by 90% from $267k to $29k from January to November. Notably, corn profits declined from $181k to a LOSS of $58k over the period while bean profits remained nearly flat at $87k. As the crop year progressed, corn proved to be much less profitable than beans due to significant corn price declines as compared to much greater stability in bean prices. By not locking in any grain at the attractive prices available early in the crop year, the farmer left open the opportunity for price upside but was also very exposed to downside pricing.
SCENARIO 2
What could this farmer have done differently early in the planning phases of the crop year to help protect anticipated profits? First, they could limit downside price risk by contracting a reasonable percentage of the farm’s anticipated production. Let’s assume that the farmer had contracted 50% of corn and beans in mid-January at $6.00 for corn and $14.00 for beans. To limit both yield and price risk, the farmer could also increase the level of government crop insurance. Let’s assume that the farmer had bumped up coverage from the 80% RP level to the 85% RP level. These two important changes would have produced a materially different initial picture of risk as well as actual outcome for the 2023 crop year.
This revised picture of risk shown below now shows a very different profile than the first picture shown above. The base case is modestly lower for farm profitability of $241k (vs $267k) due to the $26k higher cost of the switch to the RP 85% crop insurance policy. The higher level of crop insurance protection provides significantly improved nearby and overall downside protection to declines in prices and yields. The farmer’s marketing of 50% of the anticipated production materially limits downside risk to price declines while also limiting upside opportunity.
In this second scenario, the farmer took the opportunity to lock in what proved to be attractive pricing on a portion of anticipated grain – but at the 50% level -- also not so great a percentage to expose the farm to significant risk in a drought year. By January 15th the farmer also had a very good idea of the per acre costs of production and therefore had relatively limited exposure to significant input price changes. Therefore, by using the IFBT application, the farmer could see, with reasonable clarity and precision, the expected impact on profitability of potential future changes in prices and yields.

The result of these two changes (50% grain marketing and increasing crop insurance coverage) results in a significantly improved and much more stable profit picture for the farm across the 2023 crop year.
The analysis presented above shows that the farmer, under both scenarios, suffered declines in profitability over the 2023 crop year due to declines in corn prices. However, the first scenario exposed the farmer to much greater overall risks to profitability than the second scenario. In the first scenario profitability fell by $238k or 89% from $267k to $30k. In the second scenario profitability fell by $95k or 39% from $241k to $146k.
Of course, hindsight is 20/20. Crop prices could have risen and selling half the expected crop could have proven to be a costly move. And if prices had moved up, crop insurance indemnity payments would not have been triggered and the extra expense related to going from RP 80% to RP 85% coverage level would have been wasted. But had this Iowa farmer utilized the IFBT application to help assess both downside risk and upside opportunity in the planning phases of the 2023 crop year, the farmer would have been able to quantify risk and then take appropriate action to mitigate risk if desired. And if the farmer wanted instead to “roll the dice” to play for the upside, then using the IFBT tool, the farmer at least could have a clear understanding of the risks that they were taking.
CURRENT PROFIT PROFILE UNDER SCENARIOS 1 AND 2
As a final note, shown below are the current risk profiles for the farmer under each of the two scenarios discussed above. We assume that yields are now locked for the 2023 crop year and therefore yield sensitivities are now moot. Crop insurance payments for the 2023 crop year are now finalized and therefore offer no further downside price protection. The 80% RP Policy in Scenario 1 did not trigger a payout. By contrast the 85% RP policy in Scenario 2 did trigger a $19k indemnity payment for corn. The farmer in both Scenarios 1 and 2 still have both downside risk and upside price opportunity from here forward. However, in Scenario 1, the current “starting point” profitability of $30k is considerably lower and the impact of higher or lower prices is much greater than in Scenario 2. In that second scenario the current “starting point” of profitability of $146k is much higher and the impact of price changes, up or down, from here forward are much more muted.
Scenario 1 Scenario 2
 The IFBT application can be used by corn, soybean and wheat farmers across the U.S. to produce benchmark and farm specific customized budgets. By using the sensitivity analyses, farmers can visualize risk to profitability and then manage those financial risks using a variety of risk management levers available to the farmer. The application is available free for use at the website www.IFBT.farm Use it to produce a 2023 budget and manage the remaining risk for your farm’s operations for 2023. And look forward to the 2024 release of the IFBT application in January 2024 for modeling and evaluating risk for the 2024 crop year.
More Posts
- Deere Q1 Earnings Boosted 70c by One Time Items (Feb, 25)
- Deere Stock is Vulnerable (Aug, 24)
- Ag Profit Decline and Possible Impact on Deere Shares (Jan, 24)
- Corn and Soybean 2024 Projected Losses (Jan, 24)
- 2024 ARC-CO PLC Decisions Using IFBT (Jan, 24)
- 2024 Cost of Production and Breakeven Harvest Prices (Dec, 23)
- Hiding in Plain Sight - Part 2 (Dec, 23)
- Hiding in Plain Sight (Dec, 23)
- Clearing out the Cobwebs (Nov, 23)