Corn and Soybean 2024 Projected Losses
Corn and Soybean 2024 Projected Losses
Real Time View as of 1/18/24
Summary
A number of ag universities and ag extension organizations release static farm budgets in the planning phases of the crop year to help farmers make their crop year decisions. These budgets are based upon the estimated costs and revenues by individual crop and are current as of the date of the budget’s release. Corn and soybean futures prices have both eroded substantially over recent weeks and months. Therefore, the static budgets produced by ag institutions updated for these lower prices now show considerably lower profitability for each of corn and soybeans than the budgets originally suggested.
This article discusses the latest updates of these budgets utilizing current harvest prices, providing a real-time view as to the projected absolute and relative profitability of corn and soybeans. The picture that emerges is not encouraging for the 2024 crop year.
- Relative to 2023, cost budgets for 2024 across the US show an average reduction in total cost per acre for corn of 6% . Soybean total costs per acre are down by 2% on average.
- Declines in fertilizers and chemicals costs are offset by increased costs across many other cost line items resulting in these relativley modest overall declines in the total costs of production.
- New crop harvest futures in January 2024 are down 21.5% for corn and 13.5% for soybeans compared to new crop harvest futures at this time last year.
- The harvest price declines far exceed the declines in the cost of production resulting in a significant margin squeeze and much lower expected profitability for both corn and soybeans in 2024.
- An average of more than 30 individual corn and soybean budgets across the US shows a projected loss of $130/acre for corn and a loss of $53/acre for soybeans.
- The average breakeven harvest futures price for corn is $5.56/b and for soybeans is $13.18/b.
- There is considerable dispersion across the range of ag economists' budgets for crop profitability. However, only 2 of 35 corn budgets show profitability at current prices and only 5 of 31 soybean budgets show profitability at current prices.
- Lower expected crop returns are correlated with lower expected yields. For example, a farm expecting a 140 b/acre yield for corn would expect a $150/acre loss. By contrast,, a farm expecting a higher 220 b/acre yield would expect a loss of $100/acre, or a $50/acre smaller loss.
- Similarly for soybeans, a farm expecting a 45 b/acre yield for soybeans would expect a $75/acre loss. By contrast, a farm expecting a higher 65 b/acre yield would expect a loss of $20/acre, or a $55/acre smaller loss.
- On a relative basis, at current harvest futures prices, soybeans are expected to be $84/acre more profitable than corn on average.
DATA AND ANALYSIS
The data supporting the summary conclusions is provided in the tables and commentary below.
Table I. Expected Returns for Corn on 1/18/24
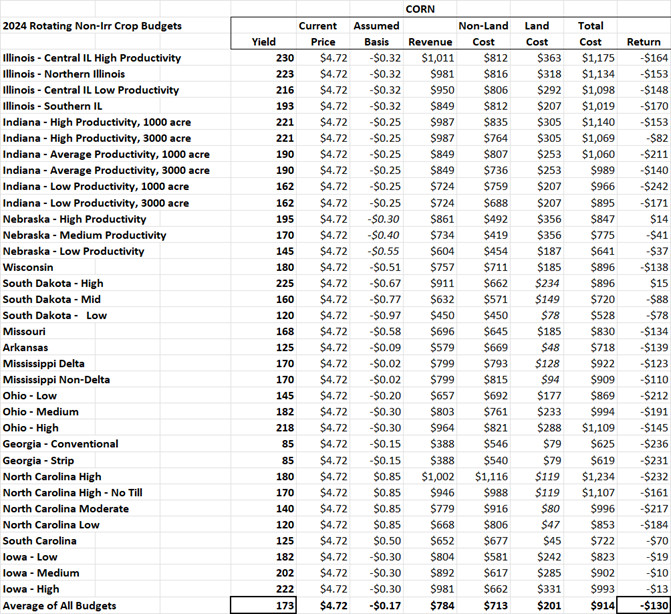
The average farm is expected to produce a yield of 173 b/acre, expects -$0.17 basis, expects grain revenue of $784/acre, has $713/acre of non-land costs, has $201/acre of land costs, a combined $914/acre of total costs, and is expected to produce a $130/acre loss at the current Dec 2024 futures price of corn of $4.72/b.
Table II. Scatter Plot of Budgeted Corn Returns and Anticipated Yields
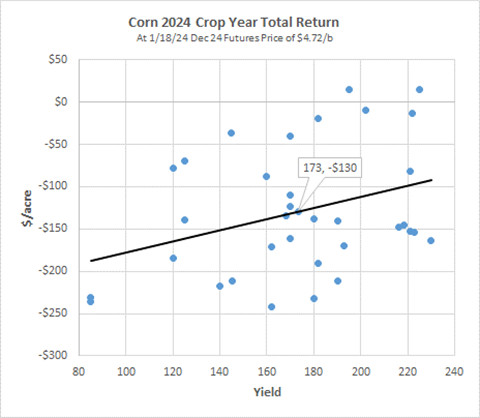
The scatter plot suggests a correlation between anticipated farm yields and projected profitability. For example, a farm with 140 b/acre expected yield would anticipate a $150/acre loss while a farm with 220 b/acre expected yield would anticipate a $100/acre loss. The average of the budgets is called out on the chart above and shows that a farm with a 173 b/acre yield would expect to produce a $130/acre loss.
Table III. Expected Returns for Soybeans on 1/18/24
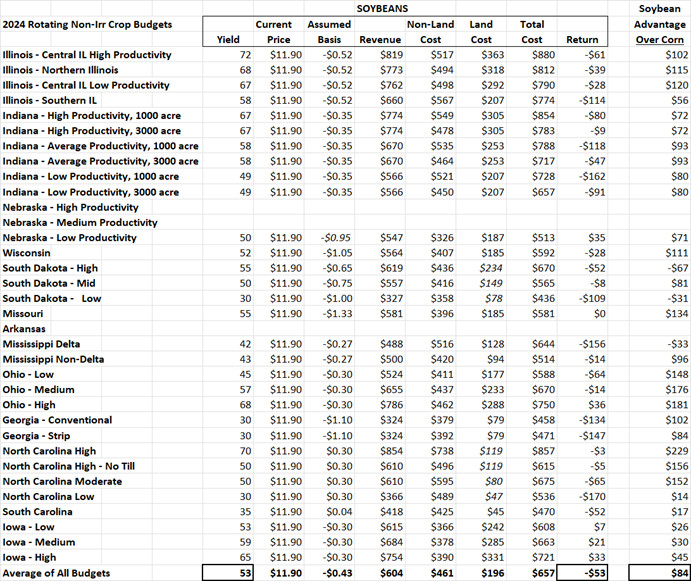
For soybeans, the average farm expects to produce a yield of 53 b/acre, expects -$0.43 basis, expects grain revenue of $604/acre, has $461/acre in non-land costs, has $196/acre in land costs, has a combined $657/acre in total costs, and is expected to produce a $53/acre loss at the current Nov 2024 futures price for soybeans of $11.90/b.
On average, soybeans provide a profit advantage of $84/acre over corn.
Table IV. Scatter Plot of Budgeted Soybean Returns and Anticipated Yields
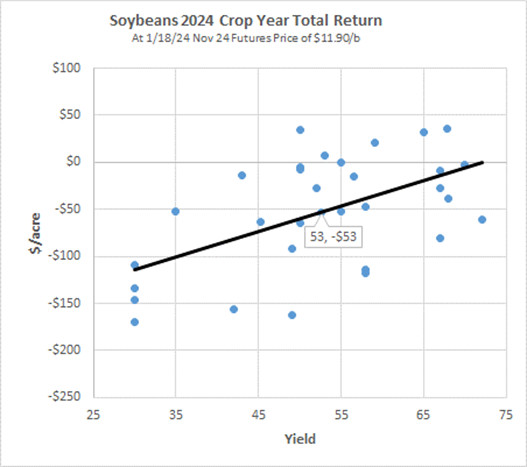
The scatter plot suggest a correlation between anticipated yields and projected profitability. For example, a farm with 45 b/acre expected yield would anticipate a $75/acre loss while a farm with 65 b/acre expected yield would anticipate a $20/acre loss. The average of the budgets is called out on the chart above and shows that a farm with a 53 b/acre yield would expect to produce a $53/acre loss.
More Posts
- Deere Q1 Earnings Boosted 70c by One Time Items (Feb, 25)
- Deere Stock is Vulnerable (Aug, 24)
- Ag Profit Decline and Possible Impact on Deere Shares (Jan, 24)
- 2024 ARC-CO PLC Decisions Using IFBT (Jan, 24)
- 2024 Cost of Production and Breakeven Harvest Prices (Dec, 23)
- Hiding in Plain Sight - Part 2 (Dec, 23)
- Hiding in Plain Sight (Dec, 23)
- Clearing out the Cobwebs (Nov, 23)
- From Joy to Despair (Nov, 23)