Hiding in Plain Sight
Do budgeted crop profits in a given crop year provide a guide for likely price action the following year?
Summary
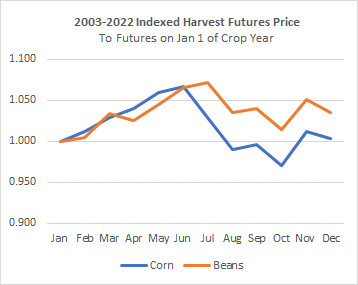
Seasonal trends in harvest prices are generally well understood and regularly discussed by academics and agricultural industry participants. Attached below is a standard picture of this monthly seasonality for corn and soybeans from January through December of the crop year. This shows the historical tendency for harvest prices for both corn and soybeans to increase from January of a given crop year through June or July. And then the tendency for prices to give up those gains as harvest approaches, only to recover modestly soon after harvest.
In this article I discuss what I believe to be is a previously undiscovered relationship, which like the seasonality shown above, appears to have a significant impact on grain price action. In this article, I present the results of the historical relationship between budgeted profitability in one crop year with the futures price action in the subsequent crop year. Using a reasonably large set of historical data, I attempt to answer the following question:
“Do budgeted crop profits in a given crop year provide a guide for likely price action the following year?”
This analysis indicates that if, in the early planning phases of a given crop year, a crop is expected to be profitable for the operator, then price action late in the subsequent crop year tends to be negative. By contrast, if the budgeted returns in a given crop year are for a loss for a crop, then the price action late in the subsequent crop year tends to be positive. Therefore, the farmer will tend to be better off frontloading grain marketing in the current crop year if the prior year was budgeted for a profit. Alternatively, the farmer will tend to be better off backloading grain marketing in the current crop year if the prior year was budgeted as a loss.
This powerful divergent trend in price action emerges only in the period after harvest and continues through to the end of the marketing year in July. Therefore, the trends discussed below are primarily relevant for farmers with access to on-farm storage or commercial storage and a willingness to defer grain marketing to after harvest.
Underlying Data and Sources
I captured 20 years of harvest futures closing prices on the first day of the month (or if not available, the immediately preceding trading day). Harvest futures prices for corn use the December CBOT contract and harvest futures for soybeans use the November CBOT contract. For each crop year, I gathered a total of 19 monthly prices, one for each month beginning in January of the crop year through to July of the following calendar year and near the end of that crop year’s marketing period.
For example, for the 2022 crop year, I captured harvest price futures data beginning on January 1st of 2022 and then for the first day of each subsequent month up through and including July 1st of 2023, providing a total of 19 individual monthly futures price datapoints. I capture the November soybean futures and the December soybean futures until those contracts expire. When those harvest futures expire in November for soybeans and December for corn, in the subsequent month I capture the following year’s July futures prices instead. To put these July futures prices on an apples-to-apples basis with the Nov bean and Dec corn harvest futures, I adjust the July futures prices downward by a calculated factor to take into account the monthly costs of interest and storage to carry the grain from harvest through to July. These estimated costs use the prevailing prime rates in each crop year and a fixed monthly storage charge. The result is a series of 19 months of harvest futures beginning in January and extending a total of 19 months to July of the next year across the last 20 historical crop years.
I then captured historical crop budget profitability estimates as of March of each crop year for each of corn and soybeans. Farm budgets from universities help guide farmers’ decisions. They also serve to document at a moment in time in the planning phases of the crop year, farmers’ collective expectations about relative and absolute crop level expected profitability. These historical budgets were, of course, dependent upon the then-current actual harvest futures prices, anticipated yields and costs present at that moment in time. The importance of our use of these March budgets is that they capture the SIGNALS that farmers were seeing at that moment in time and that they were using, both individually and collectively, in making their planting assumptions. Between planting and harvest and through to the end of the marketing year, these budgets undoubtedly changed, and often dramatically from initial expectations. Yields could have outperformed or underperformed. Prices could have increased or decreased relative to initial expectations. Total costs could vary upward or downward from initial expectations. But the farmer’s decisions that were made based upon the market-based signals captured by these early crop year budgets, had long lasting effects on grain production and an apparent significant impact on price action on a lagged basis into the subsequent crop year. The importance of the planning budgets in March is not their ultimately accuracy, but rather the effect that they had on driving farmers’ behavior in the planning phases of the crop year.
Many universities produce annual enterprise crop budgets. Likely any of these series of farm crop budgets would have been equally useful for purposes of this analysis. While the absolute values of expected crop year profits may differ from institution to institution and budget to budget, all corn, and soybean farmers are similarly impacted by changes in input costs and are subject to the same harvest futures prices. Purdue University’s Center for Commercial Agriculture has a long and consistent history of producing a set of budgets annually in March which show projected crop year profitability at that point in time. Attached, as an example, is a link to their 2023 crop year budgets produced in March of 2023. Purdue crop cost and return guide
Given their consistent and multi-year approach, I gathered their estimates for historical budgeted profitability for each of the 20 crop years during the historical period from 2002 through 2021. I use these Purdue budgets as a proxy for how farmers would have been viewing their own farm’s relative and absolute profitability by crop and to capture the signals that were present in the market on a consistent basis over time at that moment in the crop year when farmers were making critical planting decisions.
Purdue produces multiple corn and soybean budgets each year dependent upon soil productivity, farm size, and rotating or continuous cropping practices. For the purposes of this analysis, I captured the budgeted profitability for their large scale, high productivity farm and used their budgets for rotating corn and soybeans. Using a binary “tag”, I designate each SUBSEQUENT crop year as either a GAIN year or LOSS year based upon whether the PRIOR year was expected to be profitable or generate a loss. For example, in March of 2021, Purdue released a corn budget for the 2021 crop year indicating an anticipated corn profit of $90/acre for that 2021 crop year. As a result, I designated the subsequent 2022 crop year as GAIN year.
I then separate and group all the 20 historical crop years into either GAIN or LOSS years for each of corn and soybeans. Of the 20 crop years (from 2003 through 2022), corn crop years were designated as GAIN years in 9 instances and LOSS years in 11 instances. Soybeans crop years were designated as GAIN years in 8 instances and LOSS years in 12 instances. I then index the monthly harvest futures prices to January 1 at the start of each crop year and plot the associated average indexed futures prices in the line charts below.
Dramatic Differences in Price Movements Depending Upon Prior Year’s Expected Profitability
The orange line in the graph below indicates average indexed harvest price futures for the “GAIN” years. The blue line is the indexed harvest futures prices for the “LOSS” years. The grey line represents the average for all of the “GAIN” and “LOSS” years.
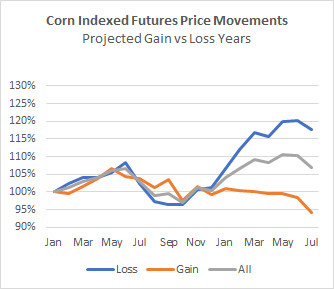
Note the quite dramatic divergence in average historical indexed futures prices for LOSS years as compared to GAIN years that commences in December after harvest and continues through July. The average of the 11 corn LOSS year’s indexed futures value increases 18% (from an indexed value of 100% to 118%). By contrast, the average of the 9 corn GAIN year’s indexed futures price decreases by 6%, to an index value of 94%. Therefore, by the end of the marketing year in July, there is very large 24% difference in the average price action from January prior to the start of the crop year to July at the end of the marketing year.
These historical patterns would suggest that the farmer would benefit from backloading contracted sales if the prior crop year’s budget was for a loss. By contrast, if the prior year’s budget was for a gain, then the farmer would benefit from frontloading the current year’s contracted sales to avoid contracting grain sales late in the crop year when there is the tendency for prices to continue to erode.
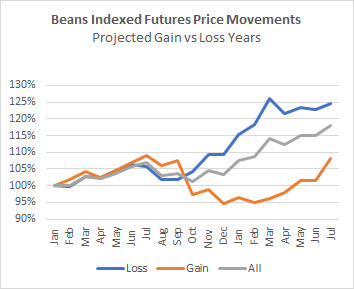
A similar pattern emerges for soybeans. As shown below, in LOSS years, prices tend to increase substantially post-harvest and all the way through the end of the marketing year in July. For GAIN years, prices tend to fall further immediately after the harvest seasonal declines. And then, unlike corn prices which continue to fade through the marketing year, bean prices in GAIN years tend to show signs of recovery late in the marketing year.
The average of the 12 bean LOSS year’s indexed futures value increases 25% from January prior to the crop year to July at the end of the marketing year. By contrast, the average of the 8 bean GAIN year’s indexed futures price closes out the marketing year up by 7%, such that at the end of the marketing period in July. Therefore, by the end of the marketing year in July, there remains a very wide gap in average price action equal to approximately 18%.
This pattern of price action for beans, much like the price action for corn, suggests that the farmer would benefit from backloading contracted sales if the prior year’s crop year’s budget was for a loss. And by contrast, the farmer would benefit from frontloading contracted sales if the prior year’s budget was for a gain. Unlike corn prices, however, bean prices on average do tend to rise late in the crop year for both LOSS and GAIN years and therefore these charts would suggest that carrying some un-marketed beans late into the marketing year could be beneficial for the farmer under both scenarios.
Practical Implications
How might a farmer use this historical information to help guide marketing strategy?
In March 2023, the 2023 corn crop was projected to be profitable with a $53/acre profit. Therefore, the upcoming 2024 crop year was designated as a GAIN year. This analysis would indicate that for the 2024 corn crop (crop year commencing soon), the farmer would again want to consider frontloading grain marketing, particularly in the seasonally strong May-July periods. History would again suggest (orange line above) that farmers have limited upside to carrying unpriced grain past the seasonally strong May-July periods and through or beyond harvest.
It is early to speculate on the 2025 crop year. However, given the relatively low 2024 harvest prices for Corn as of December 2023, if corn prices remain at or below these levels by the release of March 2024 crop budgets, then the 2024 crop year will likely project a loss for Corn. That would cause the 2025 crop year to be designated as a LOSS year. Therefore, looking far ahead into the future, a farmer might anticipate a possible post-harvest rally (blue line) and choose to backload grain marketing and carry a higher percentage of 2025 unpriced grain later into the marketing year.
Beans, by contrast, at current harvest prices as of December 2023, are expected to be profitable for the 2024 crop years. Therefore, if bean prices remain at or above current levels by the release of March 2024 crop budgets, then the 2024 bean crop year will likely project a profit for Beans. That would cause the 2025 crop year to be designated as a GAIN year. Looking far ahead into the future, a farmer might anticipate a GAIN year trajectory in bean prices causing the farmer to want to frontload grain marketing for beans to avoid the historical tendency for harvest prices to fall through and after harvest, before recovering late in the marketing year.
Caveats
Of course, averages are only those…. averages. And not every GAIN year or LOSS year will follow the same pattern of seasonal behavior. The data presented here, therefore, are by no means absolute indicators. Much like farm year seasonality, these graphics might provide the farmer with some directional historical guidance around frontloading or backloading grain marketing.
Upon a review of each of the individual annual indexed price line charts, as anticipated, there is considerable variance across years within each of the GAIN and LOSS categories. Not all lines follow the same trajectory. However, it also appears that there are not any extreme outlier years that are significantly biasing these overall average results. For example, plotting medians instead of averages provides very similar overall results.
Since about half of the 20 years examined are GAIN years and about half are LOSS years, the samples on each side are reasonably large and reasonably balanced. Nevertheless, in a future blog post I intend to analyze the statistical significance of these findings and compare them to the statistical significance of the well accepted seasonality trends. I also will test various assumptions around whether the EXTENT of expected profit or loss (instead of my use of the binary GAIN or LOSS designation) impacts upon the results. Also, as crop years move from present to the past and additional data becomes known, I will continue to expand the dataset to determine if the inclusion of new data materially alters the results or causes the statistical significance of the results to change.
Analysis of Causation and/or Correlation
What are the underlying reasons for the significant divergence in indexed futures prices between GAIN and LOSS years? Is it simply randomness in the data? Or perhaps is there a reasonable explanation for the apparent divergences in price action across GAIN and LOSS years?
I believe that the most likely rationale for these results relates to the Cobweb Theory which I discussed in a prior blog post. As farmers adapt to changing price signals, they will tend to plant more or less of a crop, which, in turn will impact upon quantities of harvested grain coming after a lag. High prices resulting in strong expected profits in a crop, will cause farmers across the country and globe to expand acreage and production, resulting in increased production and excess supply, followed by lower prices after a lag. By contrast, farmers anticipating low profitability will tend to plant less of a crop. Over time, the low prices that are causing the low profitability will cause supplies to decline, inventories to tighten and prices to rise.
The apparent divergence in indexed futures price movements between GAIN and LOSS periods is consistent with this theoretical framework. But whether this answer provides the actual true and/or complete causation is not known or perhaps even knowable. It is also not known whether these apparent trends are structural and enduring. Only time will tell if these results will be repeated into future crop years. In the meantime, just as farmers frequently take into consideration historical seasonal price variations in corn and bean prices into their marketing plans, the additional observed tendencies describe in this article between GAIN and LOSS period may provide some historical perspective that helps farmers refine and adjust their overall annual marketing plans to their long term benefit.
IFBT.Farm
The online web application IFBT.Farm is a budgeting and risk management tool for corn, soybean and wheat farmers across the U.S. It allows farmers to easily produce benchmark and customized farm budgets for a crop year. It also allows farmers to visualize the financial risks to their farm resulting from deviations in budgets relating to changes in unknown future prices and unknown actual farm crop yields. The application simultaneously integrates and models the impact of the choices that farmers can make to manage and mitigate financial risk. These include crop acreage allocations, crop insurance choices, title selection, grain marketing, land rental arrangements, among others. Importantly, as it relates to grain marketing, the application allows users to manage their futures and basis contracts and test sensitivities of overall farm financial performance to changes to harvest futures prices or changes in actual realized basis. These sensitivity analyses provide the farmer a comprehensive view of their financial risk profile entering a crop year and allow the farmer to proactively adjust their decision-making to mitigate and manage financial risk.
The IFBT.Farm application currently supports the 2023 crop year. Beginning on January 1, 2024, the IFBT.Farm application will also support farm planning and budgeting for the 2024 crop year for corn, soybean and wheat farmers across the United States. The application can be of great assistance to farmers who wish to understand the implications of their crop acreage allocations, crop insurance selections, title selections, and grain marketing approaches on their financial results--- all critical decisions that must be made relatively early on in the crop year. The application is free for use and can be accessed at www.ifbt.farm
More Posts
- Deere Q1 Earnings Boosted 70c by One Time Items (Feb, 25)
- Deere Stock is Vulnerable (Aug, 24)
- Ag Profit Decline and Possible Impact on Deere Shares (Jan, 24)
- Corn and Soybean 2024 Projected Losses (Jan, 24)
- 2024 ARC-CO PLC Decisions Using IFBT (Jan, 24)
- 2024 Cost of Production and Breakeven Harvest Prices (Dec, 23)
- Hiding in Plain Sight - Part 2 (Dec, 23)
- Clearing out the Cobwebs (Nov, 23)
- From Joy to Despair (Nov, 23)